Randomize Guide: Bootstrap Interval for Two Proportions
This guide finds a bootstrap confidence interval for the difference between two proportions in Jamovi with the Randomize module. The example uses two questions from the practice survey data. With that file open you should get the same table and the same difference. Your interval will be close to the one shown but not identical, because it comes from a simulation.
The worked example
The survey asked how much sleep you typically get on a school night (sleep_weeknight, in hours) and whether you ate breakfast today (ate_breakfast, Yes or No). Of the 156 students who answered both, 17 of the 32 who sleep less than seven hours skipped breakfast (0.531), compared with 30 of the 124 who sleep seven or more (0.242). The difference is 0.29.
The hypothesis test guide tests whether a gap like that could come from chance. This guide estimates the size of the gap with a confidence interval.
Research question: how much more often do students who sleep less than seven hours skip breakfast than students who sleep seven or more?
We estimate \(p_1 - p_2\), where \(p_1\) is the proportion who skip breakfast among students who sleep less than seven hours, and \(p_2\) is the proportion among those who sleep seven or more.
How the bootstrap works
The bootstrap uses the sample as a stand-in for the population. Each resample draws 156 students at random, with replacement, from the 156 in the sample, so some students come up more than once and some not at all. Each student keeps both answers, their sleep group and whether they skipped breakfast, and Jamovi computes the difference in proportions for the resample. Unlike the permutation test, the bootstrap does not shuffle answers between the groups.
After 1000 resamples, the differences show how much the estimate varies from sample to sample. The middle 95% of them, from the 2.5th to the 97.5th percentile, is the 95% confidence interval.
What you need
- Jamovi 2.7.38 with the Randomize module installed. If Randomize is not in your Analyses ribbon, see the Jamovi Setup Guide.
- The practice survey file, practice_survey.csv. Open it with the hamburger menu (three lines, top left), Open, then Browse.
Step 1: Filter out the blanks
Click the Data tab, then the Filters icon.
In the field next to the \(f_x\) button, type:
sleep_weeknight != NA and ate_breakfast != NAMake sure the toggle labeled active is green.
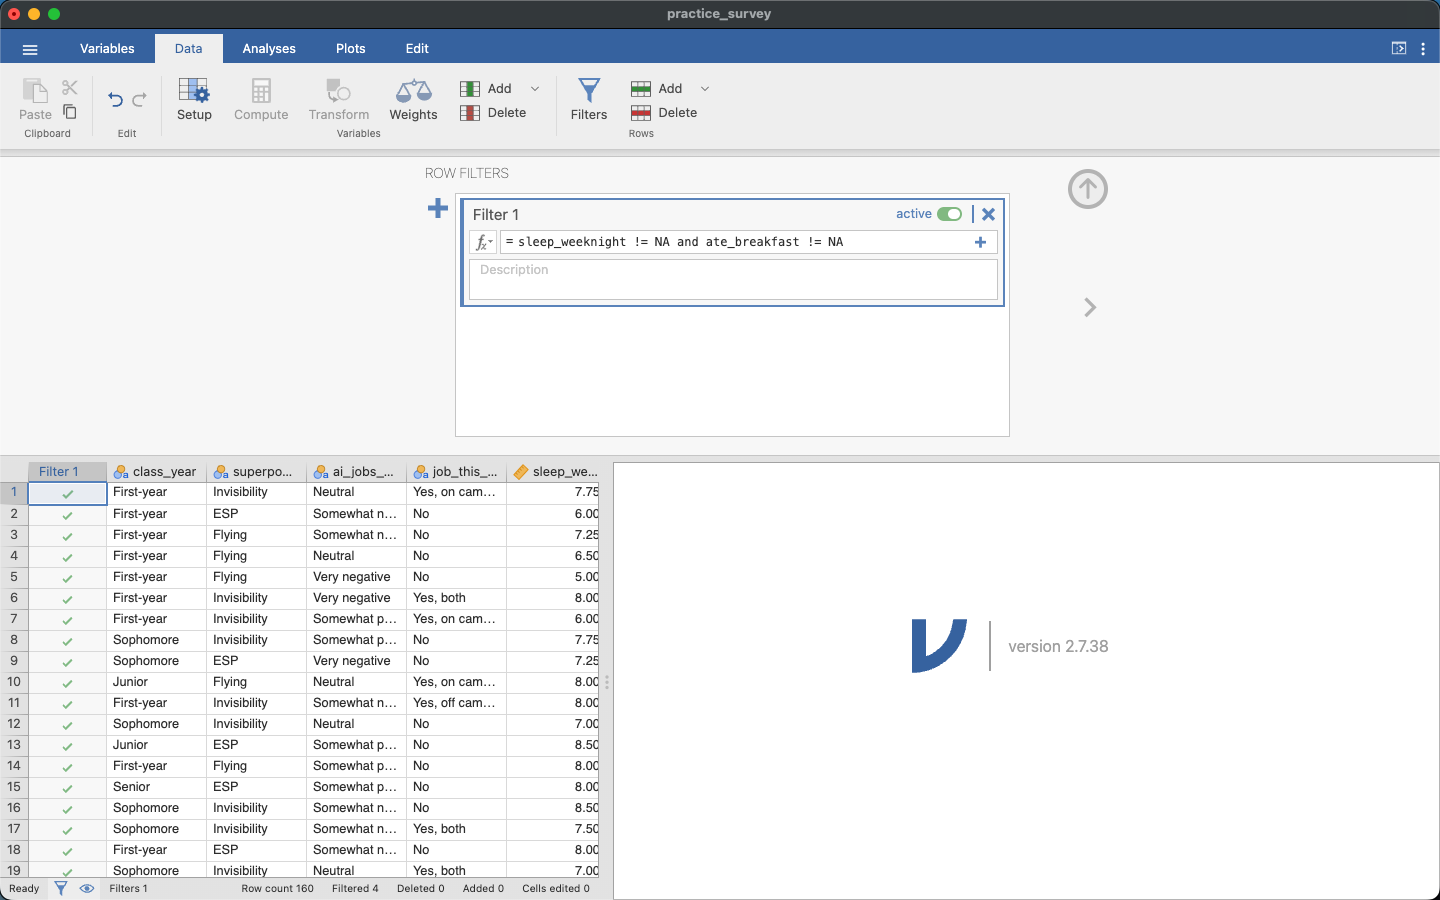
Check your work. The status bar below the spreadsheet should read Row count 160 and Filtered 4, which leaves 156 students.
Step 2: Recode sleep into two levels
Click the Variables tab. Type
sleep_weeknightin the search box and check its box.Click Transform.
Change the name of the new variable to
sleep7.In the using transform pull-down, choose Create New Transform….
In the field next to \(f_x\), type:
IF($source < 7, "less than seven", "seven or more")
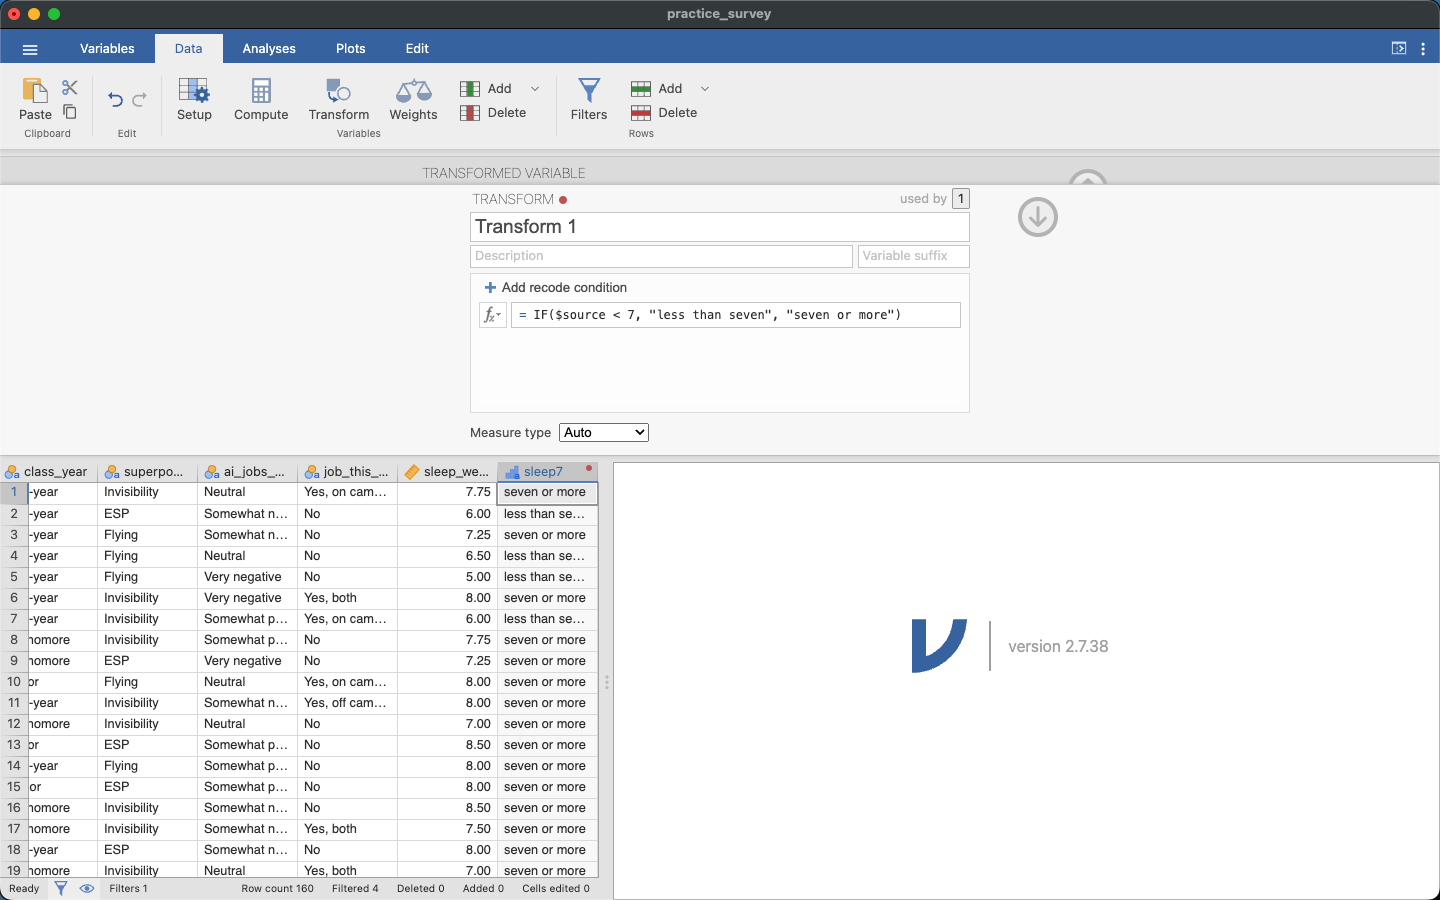
Randomize takes the first level of the row variable as group 1 and counts the first level of the column variable. Jamovi puts levels in alphabetical order, so less than seven is group 1, and No (skipped breakfast) is the level counted. The two categorical variables guide shows how to change the order if your question needs the other level.
Step 3: Open the analysis
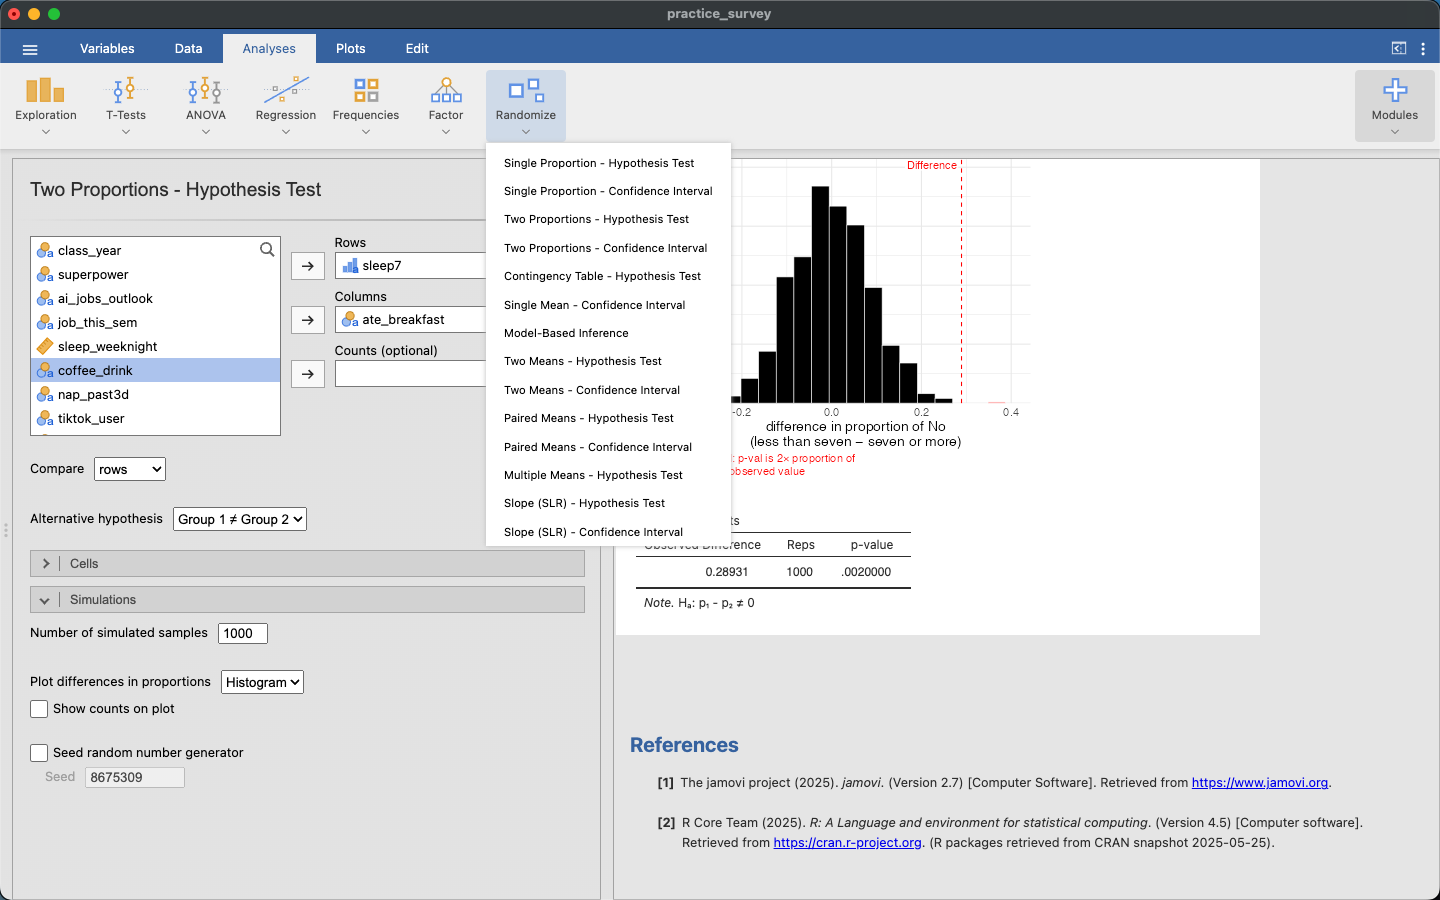
Click the Analyses tab, then Randomize, then Two Proportions - Confidence Interval.
Step 4: Set it up
Use the search box above the variable list to find each variable, select it, and click the arrow next to the box it belongs in. Then expand Simulations.
| Option | Value | Why |
|---|---|---|
| Rows | sleep7 |
the explanatory variable, recoded |
| Columns | ate_breakfast |
the response variable |
| Compare | rows | compare the two sleep groups |
| Confidence level | 95 |
a 95% interval |
| Type of confidence interval | bootstrap percentile | the middle 95% of the resampled differences |
| Number of simulated samples | 1000 |
enough for steady percentiles |
| Plot difference in proportions | Histogram | 1000 dots would overlap, so bin them |
Leave Counts (optional) empty, and leave Show counts on plot and Seed random number generator unchecked.
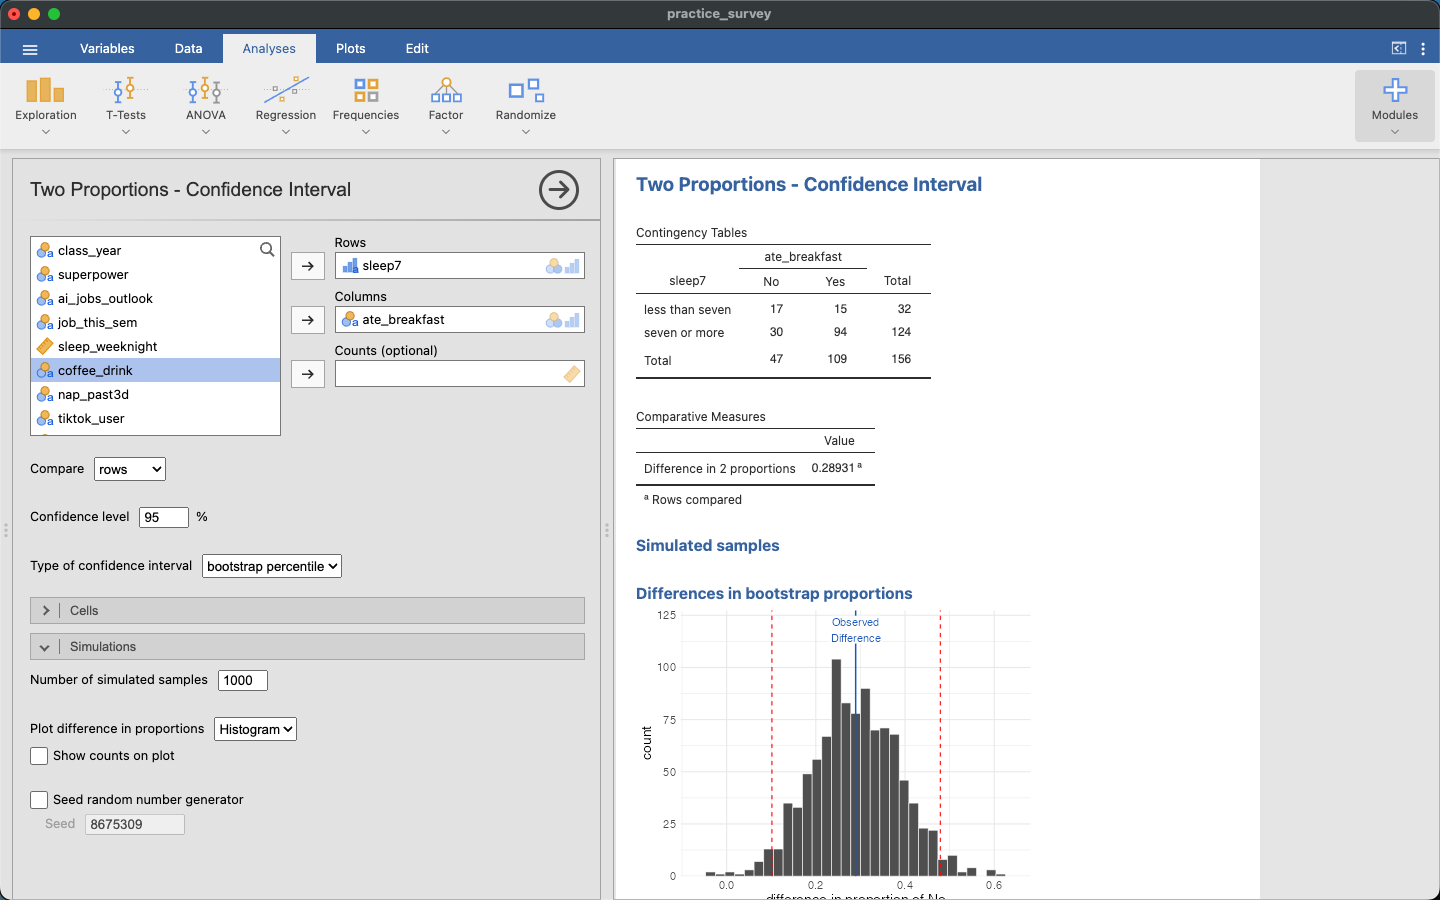
Check your work. The contingency table should show 17, 15, and 32 in the first row, 30, 94, and 124 in the second, and 156 in total. Difference in 2 proportions should be 0.28931.
Step 5: Read the output
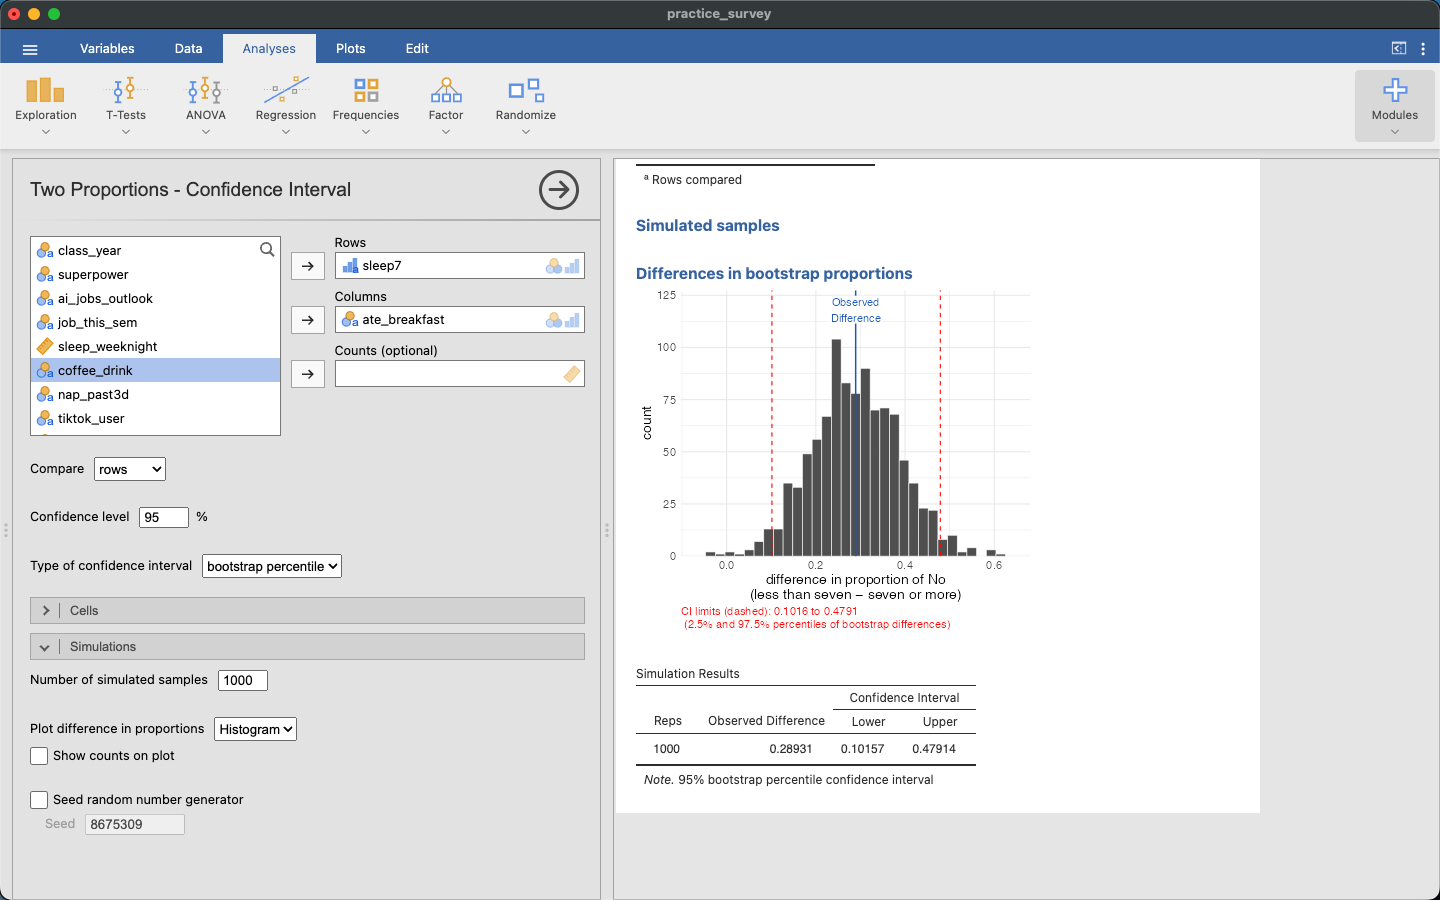
The bootstrap distribution. The histogram shows the 1000 differences from resampling. It is centered near the observed difference, 0.29, not at 0, because the bootstrap keeps each student’s two answers together. The solid blue line marks the observed difference, and the two dashed red lines mark the 2.5th and 97.5th percentiles.
The interval. The Simulation Results table gives the two endpoints.
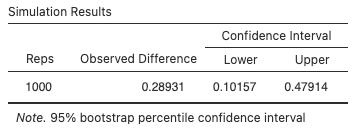
In this run the interval is 0.102 to 0.479. Each run resamples again, so your endpoints will differ, usually by 0.02 or less.
The conclusion
We are 95% confident that the proportion who skip breakfast is between about 0.10 and 0.48 higher for students who sleep less than seven hours than for students who sleep seven or more.
The interval does not contain 0, so a difference of 0 is not a plausible value, which agrees with the hypothesis test. The interval is also wide. The gap could be as small as about 10 percentage points or as large as about 48. Nobody was assigned an amount of sleep, so the interval does not say why the gap is there.
If your numbers don’t match
| What you see | What went wrong |
|---|---|
| The status bar doesn’t read Filtered 4 | The filter is not active, or it mentions only one of the two variables. Both != NA conditions belong in one filter line |
| Difference in 2 proportions is −0.28931, and the interval is negative | One level order is flipped: seven or more is the first row, or Yes is the first column. Fix the labels so the order matches your question. |
| A table with many rows, and no interval | sleep_weeknight is in Rows instead of sleep7. |
| An interval wider than 0.10 to 0.48 | The confidence level is above 95. |
| Endpoints that jump around from run to run | The number of simulated samples is still 100. |
| Endpoints a little different from 0.102 and 0.479 | That’s expected, because each run resamples again. |
| No Randomize in the Analyses ribbon | The module is not installed. See the Jamovi Setup Guide. |
Practice on a second question
How much more often do coffee drinkers nap? The survey columns are coffee_drink (Do you regularly drink coffee?) and nap_past3d (Have you taken a nap in the past 3 days?). Both are already Yes or No.
- Filter:
coffee_drink != NA and nap_past3d != NA, which leaves 158 students. - Rows
coffee_drink, Columnsnap_past3d, Compare rows, 95, bootstrap percentile, 1000 simulated samples, Histogram.
No sorts before Yes in both columns, so group 1 is the students who don’t drink coffee, and the level counted is No, didn’t nap. The difference is 0.077, and the interval should come out near −0.08 to 0.23. It contains 0, so a difference of 0 is plausible, which agrees with the hypothesis test’s p-value of about 0.42.