Jamovi Guide: Is X Related to Y? Two Categorical Variables
This guide goes through comparing two groups on a yes/no answer in Jamovi: filtering out the blanks, recoding a survey question into two levels, making a contingency table with row percentages, and reading the conditional proportions and the stacked bar plot. The example uses two questions from the practice survey data, so if you follow along with that file open you should see the same numbers.
The worked example
The survey asked how much sleep you typically get on a school night (sleep_weeknight, in hours) and whether you ate breakfast today (ate_breakfast, Yes or No).
Research question: among the students in the survey, do the ones who sleep less than seven hours skip breakfast more often than the ones who sleep seven or more?
That is a question about two categorical variables, each with two levels:
- Explanatory variable: sleep, split into less than seven hours and seven or more. The survey recorded hours, so we have to recode it.
- Response variable: breakfast, Yes or No. The level we are counting is No, skipped breakfast.
To answer it we compare two conditional proportions, the proportion of short sleepers who skipped breakfast, and the proportion of everyone else who did. The difference between them is what we report.
What you need
- Jamovi 2.7.38. The Randomize module isn’t used in this guide; everything here is in Jamovi itself.
- The practice survey file, practice_survey.csv. Open it with the hamburger menu (three lines, top left), Open, then Browse.
Step 1: Filter out the blanks on both variables
Every survey question was optional. A student who skipped either question can’t be placed in the table, so we drop the blanks on both. One filter line does it.
Click the Data tab, then the Filters icon.
In the formula box, type:
sleep_weeknight != NA and ate_breakfast != NACheck that the filter’s toggle is green (active).
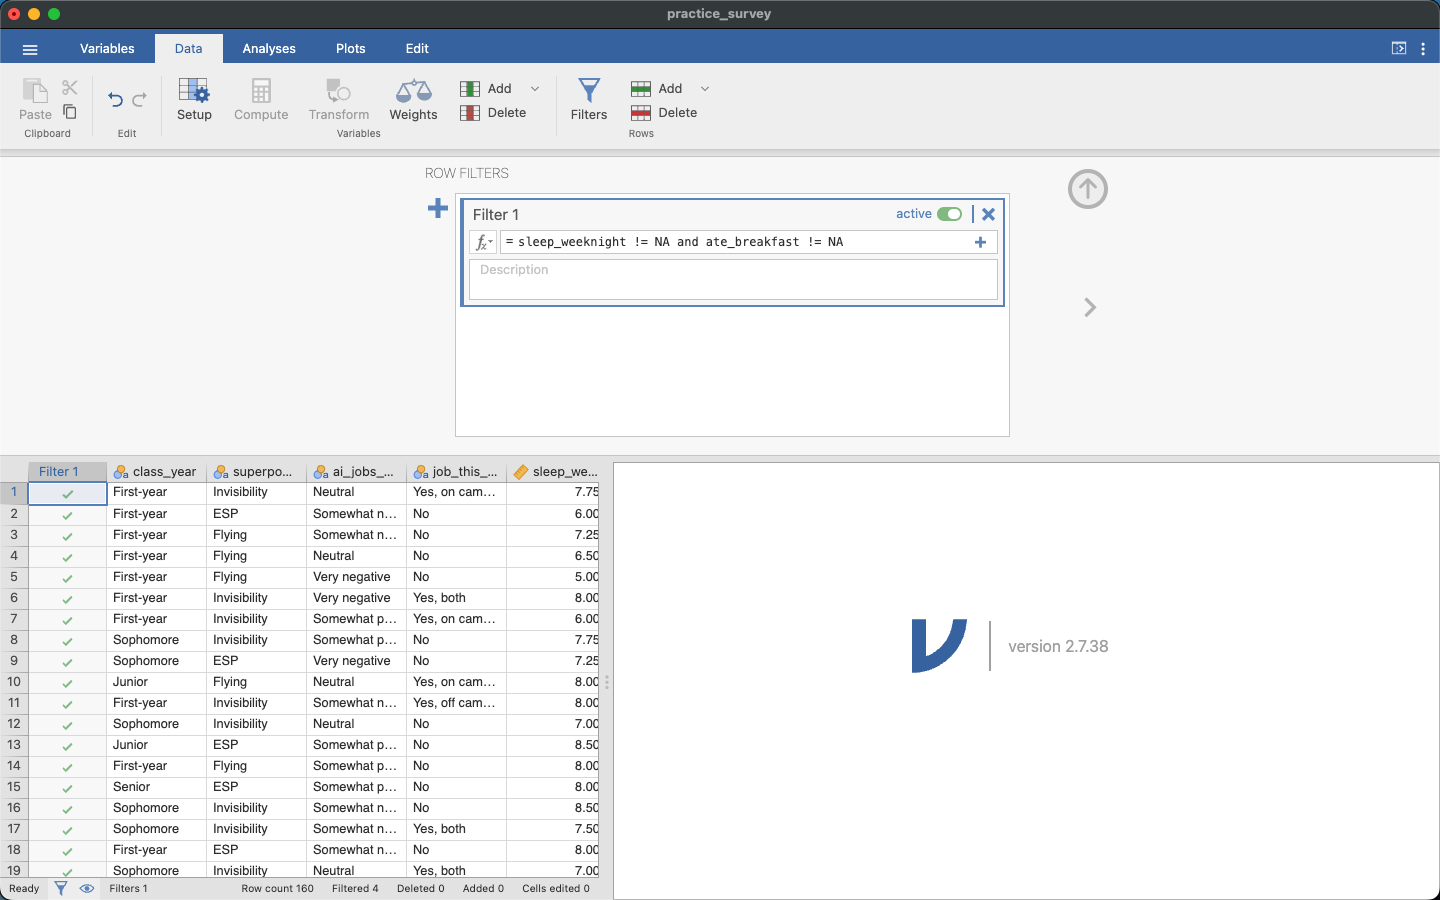
Check your work. The status bar should read Row count 160 and Filtered 4, so 156 students remain. That 156 is your \(n\). Two students skipped the sleep question, two skipped the breakfast question, and nobody skipped both.
Step 2: Recode sleep into two levels
Sleep was recorded in hours, and we need two groups, so we recode each answer into one of two labels.
Find the column. Click the Variables tab, type
sleep_weeknightin the search box above the list, and click it in the list. Then click the Data tab. The spreadsheet will be scrolled to that column, and the column will already be selected.Click the Transform icon.
Change the name of the new variable to
sleep7.In the pull-down labeled using transform, choose Create New Transform….
In the \(f_x\) box, type the recode condition:
IF($source < 7, "less than seven", "seven or more")
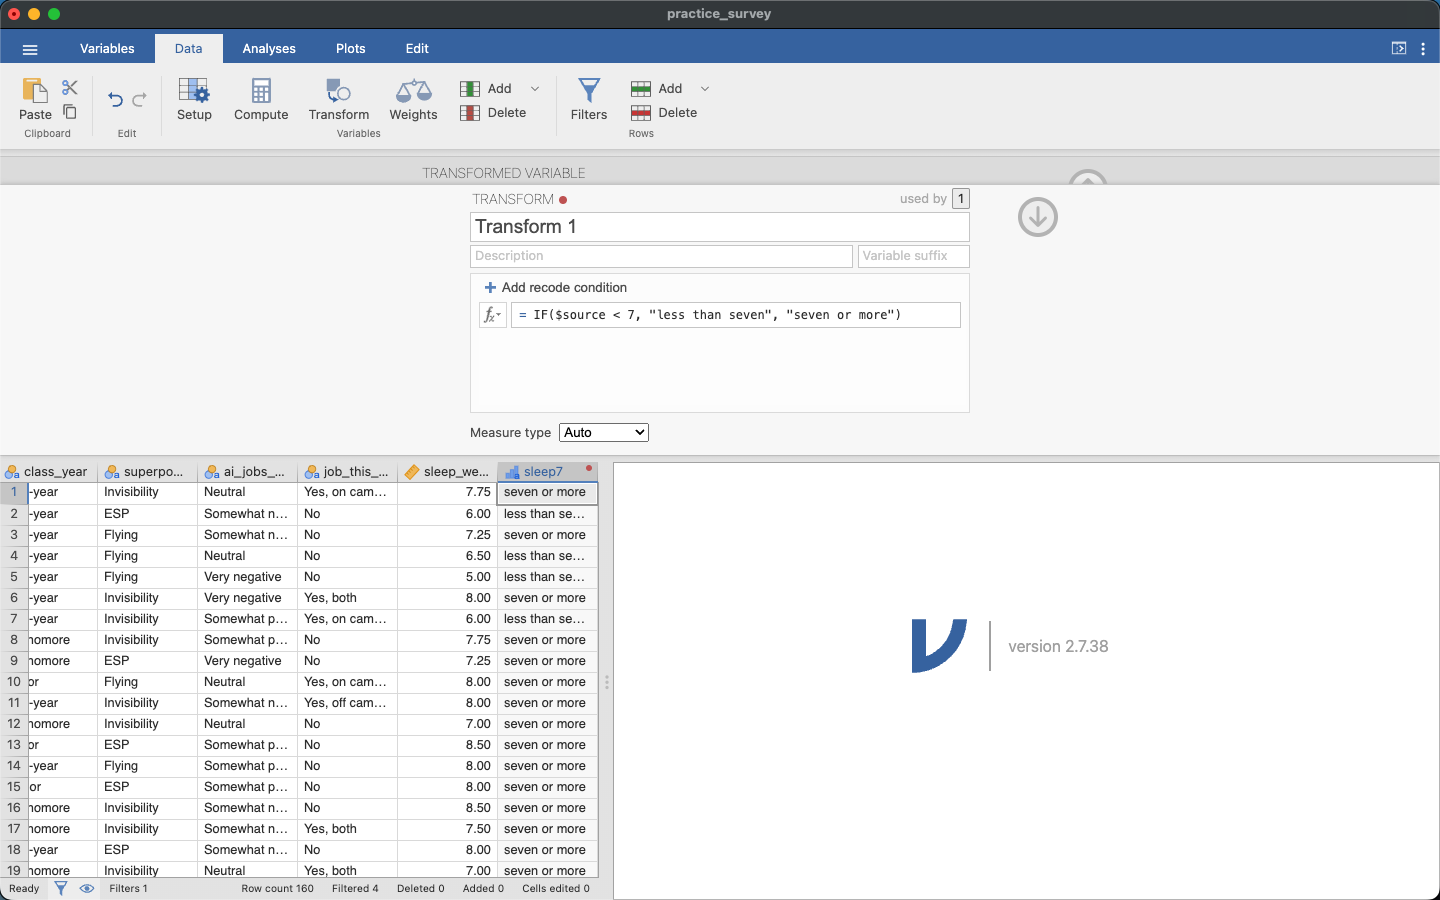
$source is the original sleep column; anything under 7 becomes “less than seven” and everything else “seven or more”.
Since the source column is numeric, the condition compares numbers: 6.75 becomes less than seven, and exactly 7.00 becomes seven or more. Compare a few rows of the new column with the old one to make sure it did what you meant.
Why these labels, and why “No” is the level we count
The labels matter, because Jamovi lists the levels of a recoded variable alphabetically, and the two-variable tools take the first level as the reference. In a contingency table the first level is the top row. In Randomize’s two-proportion tools, the first row level is group 1 and the first column level is the one that gets counted, and the difference is reported as group 1 minus group 2.
So the labels decide what the difference means:
less than sevensorts beforeseven or more, so the short sleepers are the first row, group 1.- For
ate_breakfast, No sorts before Yes, so No is the level counted. That fits our question, which is about skipping breakfast.
If your question is about the other level, say, eating breakfast, you have two options. Recode the response as well, with labels that sort the way you want: IF($source == "Yes", "ate", "skipped") makes ate the first level. Or, for an original survey variable, click its column header, click Setup, and use the arrows next to the Levels box to move the level you want to the top.
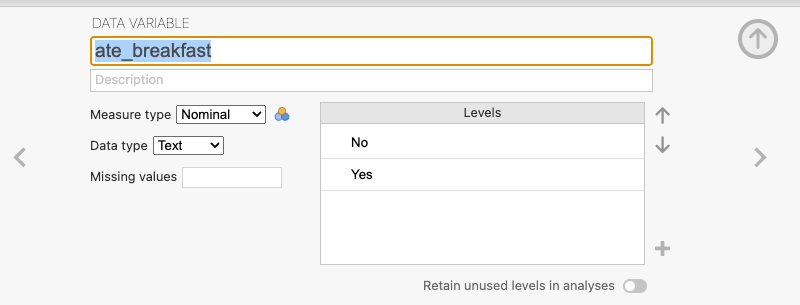
ate_breakfast. The Levels box shows the order Jamovi will use; the arrows on the right change it.
Whichever you do, write down which level you are counting. A difference of 0.29 needs a note saying what was counted and which group came first.
Step 3: The contingency table
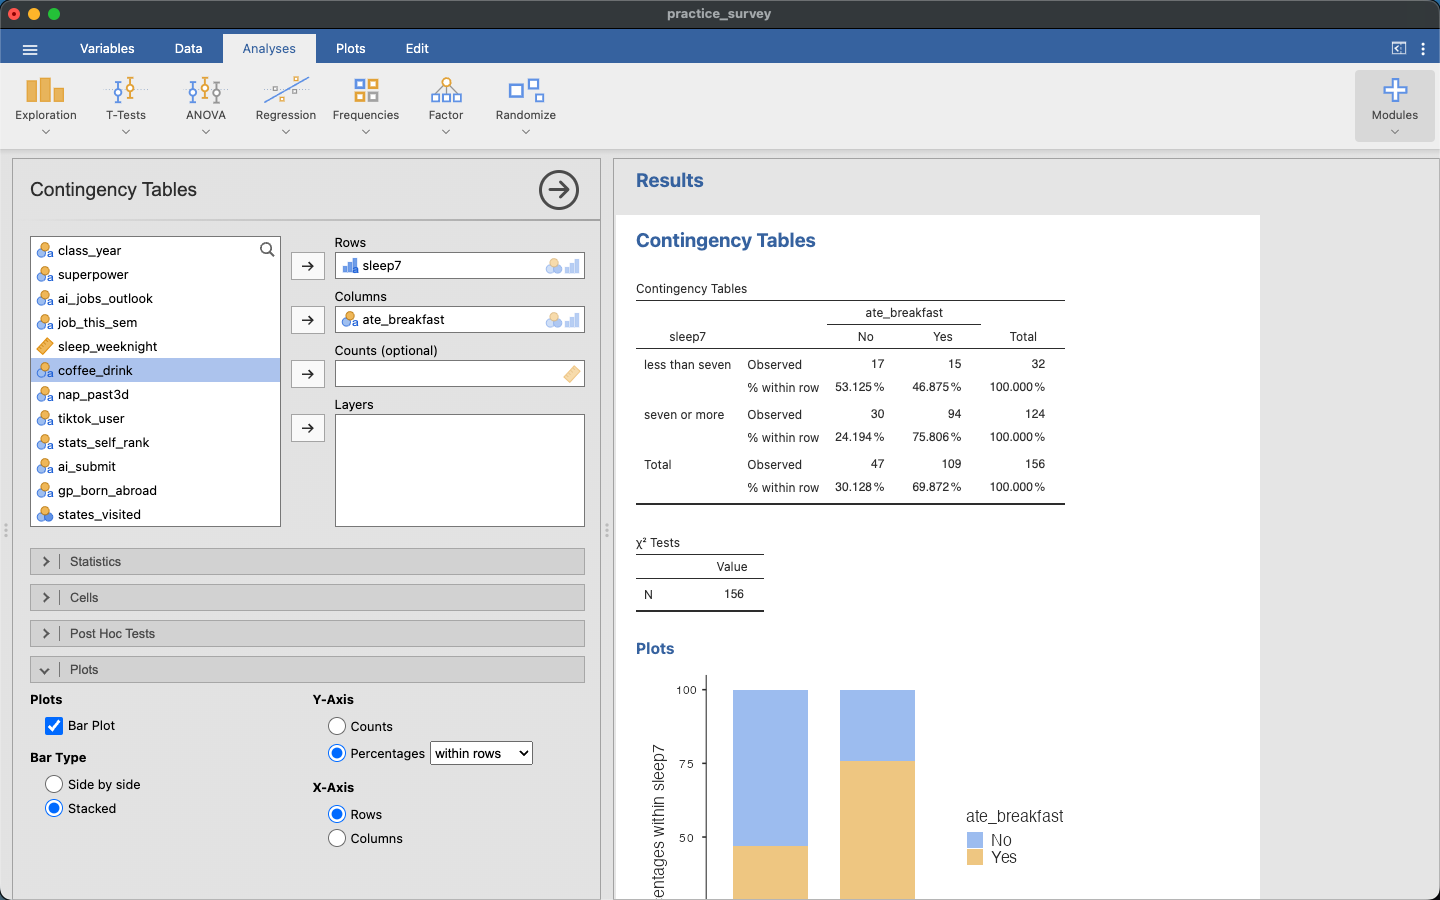
- Click the Analyses tab, then Frequencies, then Independent Samples (under Contingency Tables).
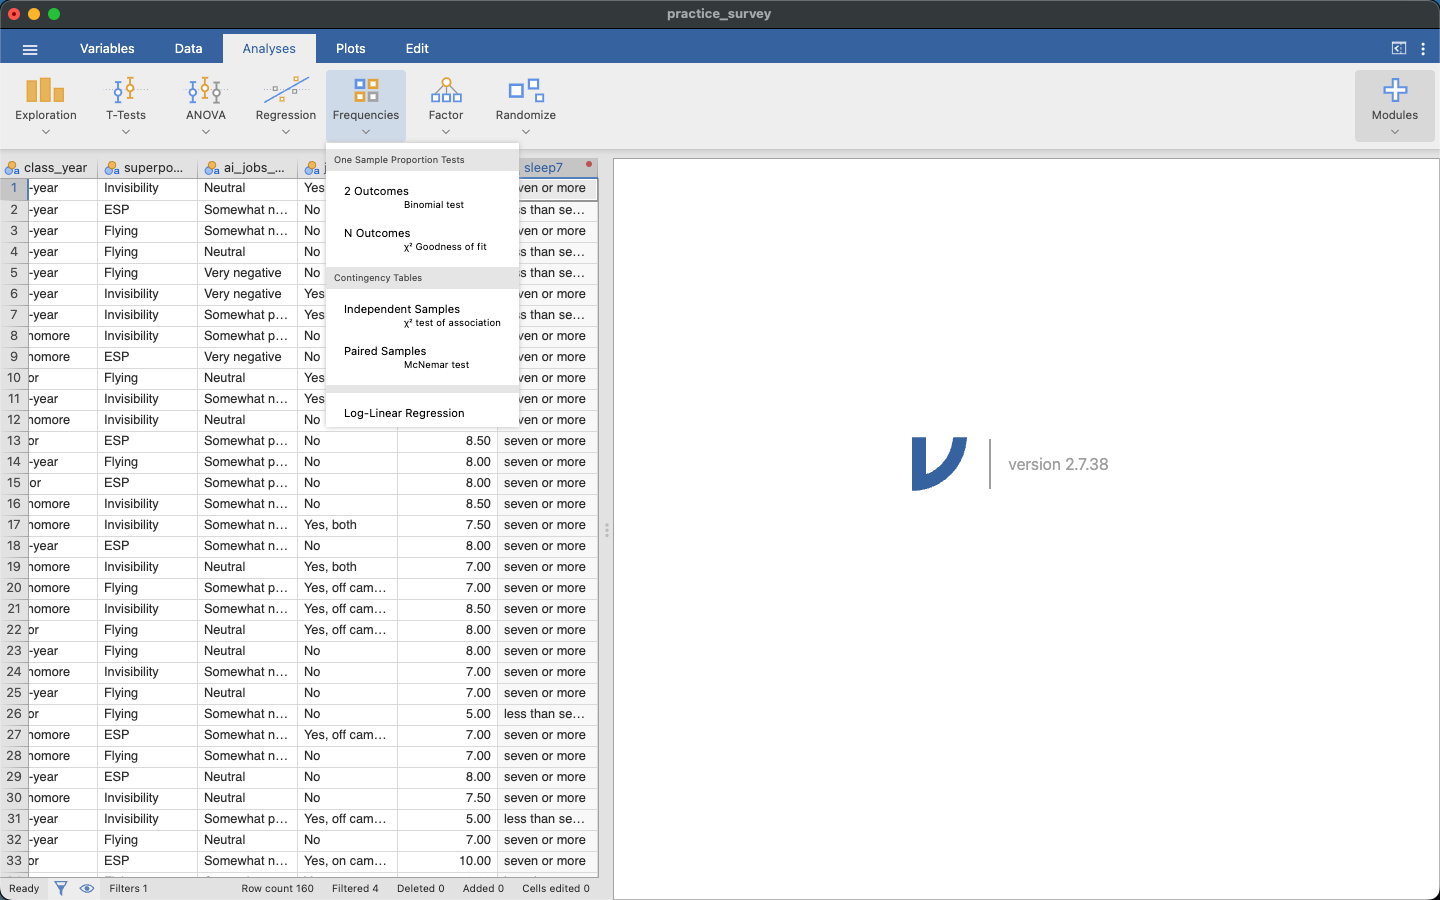
- Put the explanatory variable in Rows:
sleep7. Put the response in Columns:ate_breakfast. The search box above the variable list finds them quickly. - Expand Cells. Under Percentages, check Row.
- Expand Statistics and uncheck χ². We don’t use that test here.
- Expand Plots. Check Bar Plot; under Bar Type choose Stacked; under Y-Axis choose Percentages and set the pull-down to within rows.
Step 4: Read the table
| sleep7 | No | Yes | Total | |
|---|---|---|---|---|
| less than seven | Observed | 17 | 15 | 32 |
| % within row | 53.125 % | 46.875 % | 100 % | |
| seven or more | Observed | 30 | 94 | 124 |
| % within row | 24.194 % | 75.806 % | 100 % | |
| Total | Observed | 47 | 109 | 156 |
The two conditional proportions are the % within row entries in the No column, the level we are counting:
\[\hat p_{\text{less than seven}} = \frac{17}{32} = 0.531 \qquad \hat p_{\text{seven or more}} = \frac{30}{124} = 0.242\]
and the difference, first row minus second row, is
\[0.531 - 0.242 = 0.289.\]
In this sample, students who sleep less than seven hours skipped breakfast about 29 percentage points more often than students who sleep seven or more.
With the explanatory variable in the rows, the row percentages are the ones we want. Each row is one sleep group, and the percentage answers “of these students, what share skipped breakfast?” Column percentages would answer a different question, “of the students who skipped breakfast, what share are short sleepers?”, which is not the one we asked.
Step 5: The bar plot
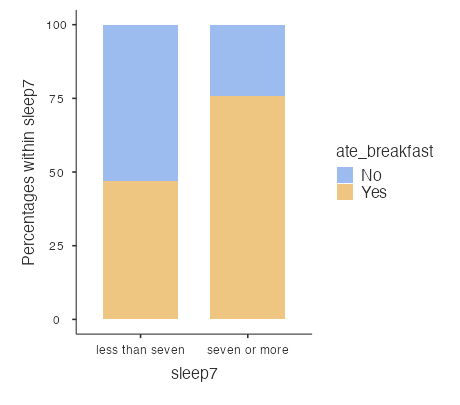
Each bar is one level of the explanatory variable, and each is rescaled to its own total, so the two bars can be compared directly no matter how many students are in each group (32 in one, 124 in the other). The No segment is the conditional proportion: it fills about 53% of the first bar and about 24% of the second. If the No segment is a noticeably different height in the two bars, the variables are associated in this sample. If the bars look about the same, they aren’t.
The conclusion
In this sample, sleep and breakfast are associated: 53% of the short sleepers skipped breakfast, against 24% of everyone else, a difference of 0.29.
Two cautions. This describes the 156 students in the data. Whether a gap this size could be due to chance alone is a question for a hypothesis test, not for this table. And it doesn’t say why the gap is there. Short sleep might lead to skipping breakfast, or an early class might cause both.
If your numbers don’t match
| What you see | What went wrong |
|---|---|
| The status bar doesn’t read Filtered 4 | The filter is not active, or it mentions only one of the two variables. Both != NA conditions belong in one filter line |
seven or more is the top row |
The labels sort the other way. Rename them so the group you want first sorts first |
| The percentages add to 100 down a column instead of across a row | Under Cells you checked Column instead of Row |
| The bars are different heights | The plot’s Y-Axis is on Counts, or Percentages of total. It should be Percentages within rows |
| A χ² table with a p-value shows up | The χ² box under Statistics is still checked. Uncheck it, or ignore it for now |
Every row of sleep7 says “seven or more” |
Check the condition. $source < 7 is a comparison with a number; if the 7 is in quotes it becomes text and the comparison fails |
Practice on a second question
Are first-year students less likely to have a job this semester than everyone else? The survey columns are class_year (First-year, Sophomore, Junior, Senior, and Non-degree seeking) and job_this_sem (No, or three kinds of Yes). Both need a recode, and this time both recodes are of text, so the conditions are matches rather than comparisons.
- Filter:
class_year != NA and job_this_sem != NA, which leaves 158 students (two skipped the job question). - Recode
class_yearintoyear2:IF($source == "First-year", "first-year", "other"). first-year sorts first, so first-years are group 1. - Recode
job_this_semintojob2:IF($source == "No", "none", "job"). job sorts before none, so having a job is the level counted. - Rows
year2, Columnsjob2, row percentages, stacked bar plot within rows.
You should get 20 of 69 first-years with a job, \(\hat p = 0.290\), against 49 of 89 for everyone else, \(\hat p = 0.551\). The difference, first row minus second, is \(0.290 - 0.551 = -0.26\). The sign is negative because group 1 is the lower one, and that is fine as long as you say so. That is a large association, though not a surprising one.