Randomize Guide: Hypothesis Test for a Single Proportion
This guide goes through a single-proportion hypothesis test in Jamovi: filtering out the blanks, recoding a survey question into two levels, checking your counts, and running the test in the Randomize module. The worked example uses the self-ranking question from the practice survey data, so if you follow along with that file open you should see the same numbers.
The worked example
The survey asked where you think your statistical ability falls among the students taking statistics with you this semester: top third, middle third, or bottom third.
By construction, exactly one third of any group is in the top third. So if everyone placed themselves accurately, about one third of the answers would say “Top third.”
Research question: do the students in the survey under-claim? That is, is the proportion who would say “top third” less than one third?
\[H_0: p = 1/3 \qquad H_A: p < 1/3\]
where \(p\) is the proportion of students who would say “top third.”
What you need
- Jamovi 2.7.38 with the Randomize module installed. If Randomize is not in your Analyses ribbon, see the Jamovi Setup Guide.
- The practice survey file, practice_survey.csv. Download it and note where it saved (usually your Downloads folder).
Step 1: Open the data
Open Jamovi. Click the hamburger menu (the three horizontal lines in the top-left corner), choose Open, then Browse, and select practice_survey.csv.
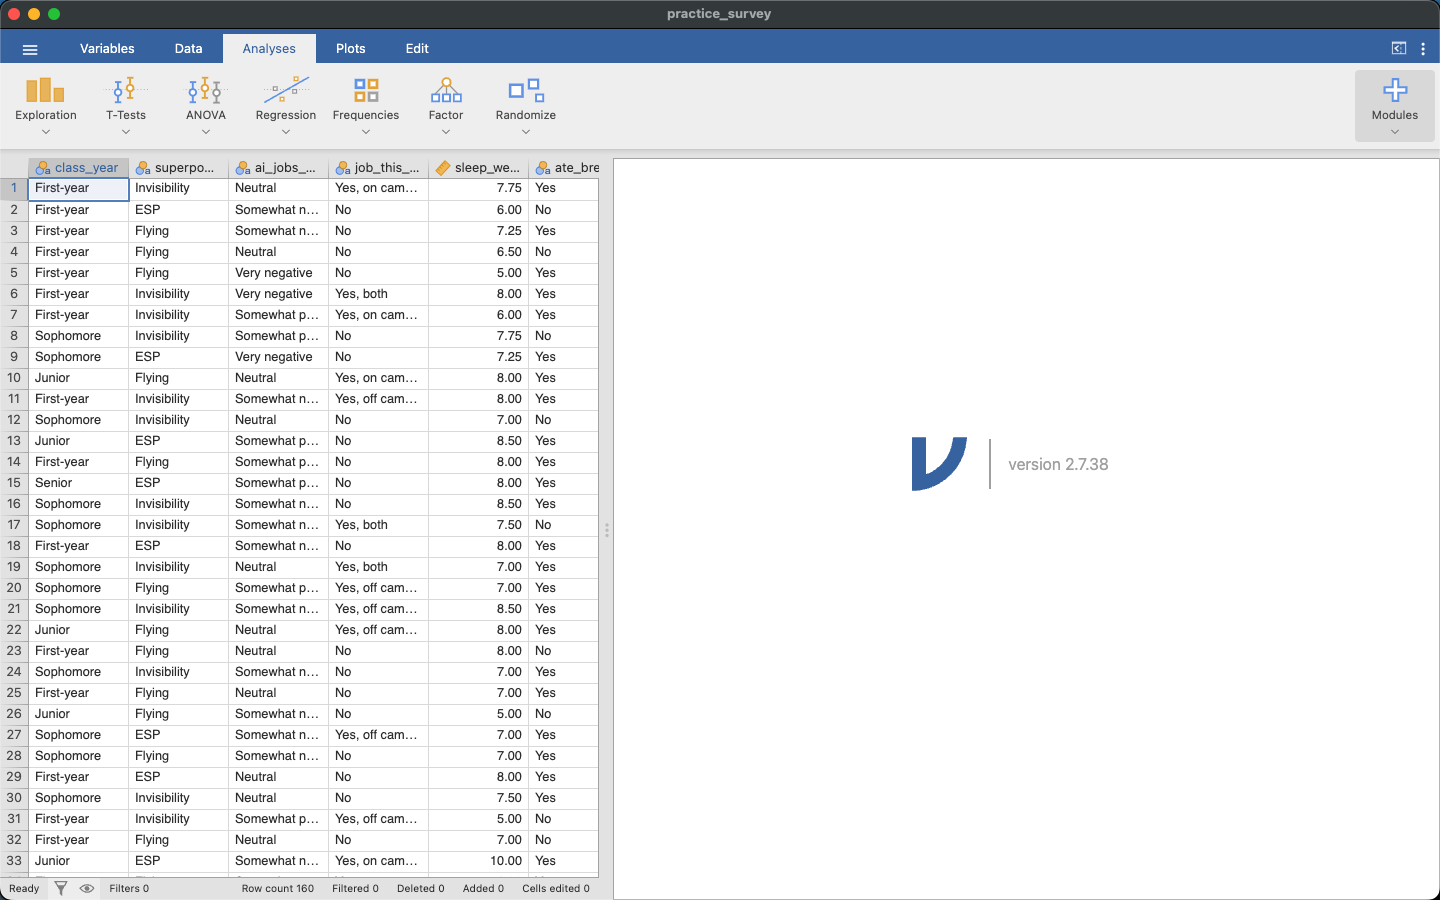
The column we want is stats_self_rank. Scroll right to find it, or use the Variables tab to see the full list of column names.
Step 2: Filter out the blanks
Every survey question was optional, so in a real survey some students skip any given question. A blank means the student didn’t answer, which is different from answering “no,” so the blanks have to come out before we count anything.
Click the Data tab, then click the Filters icon.
In the field next to the \(f_x\) button, type:
stats_self_rank != NAMake sure the filter is active. The toggle switch above the text field should be green.
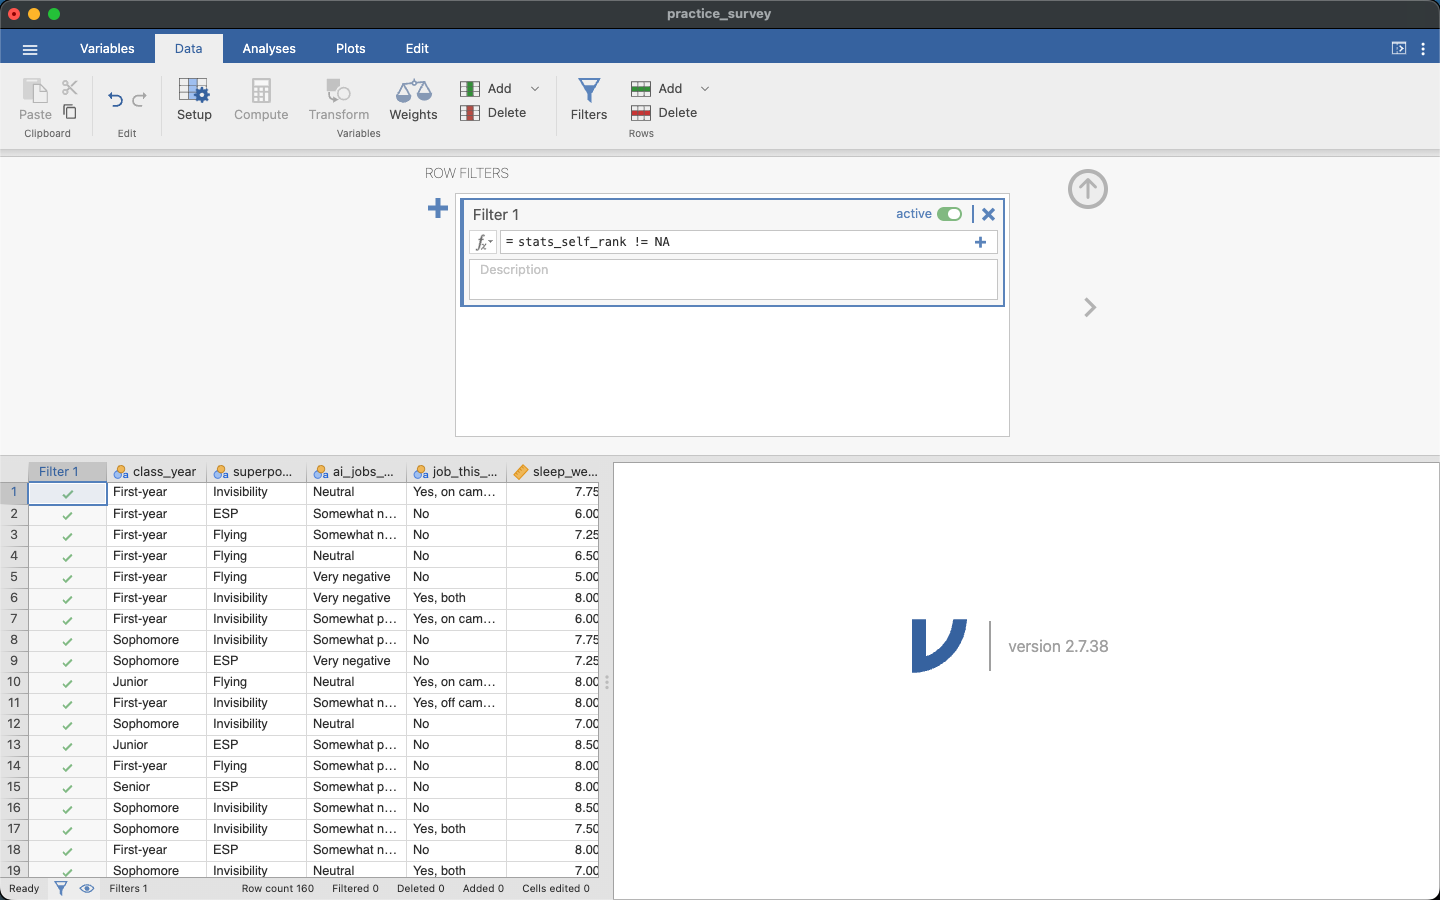
In the filter syntax, != means does not equal, and NA is how Jamovi refers to a missing value. So this filter keeps the rows where stats_self_rank was answered.
Check your work. The status bar below the spreadsheet should read Row count 160 and Filtered 0. Nobody in the practice file skipped this question, so all 160 rows remain. Each row that passes the filter also gets a green check in the new Filter 1 column.
Step 3: Recode to two levels
The question has three answers, but our parameter is a single proportion, the share who say “top third,” so we collapse the three levels into two.
Click the Data tab.
Click the header of the
stats_self_rankcolumn so it is selected.Click the Transform icon.
Change the name of the new variable to
claims_top(by default it will be something likestats_self_rank (2)).In the pull-down box labeled using transform, select Create New Transform….
In the text field labeled \(f_x\), type this recode condition:
IF($source == "Top third", "claims top", "other")
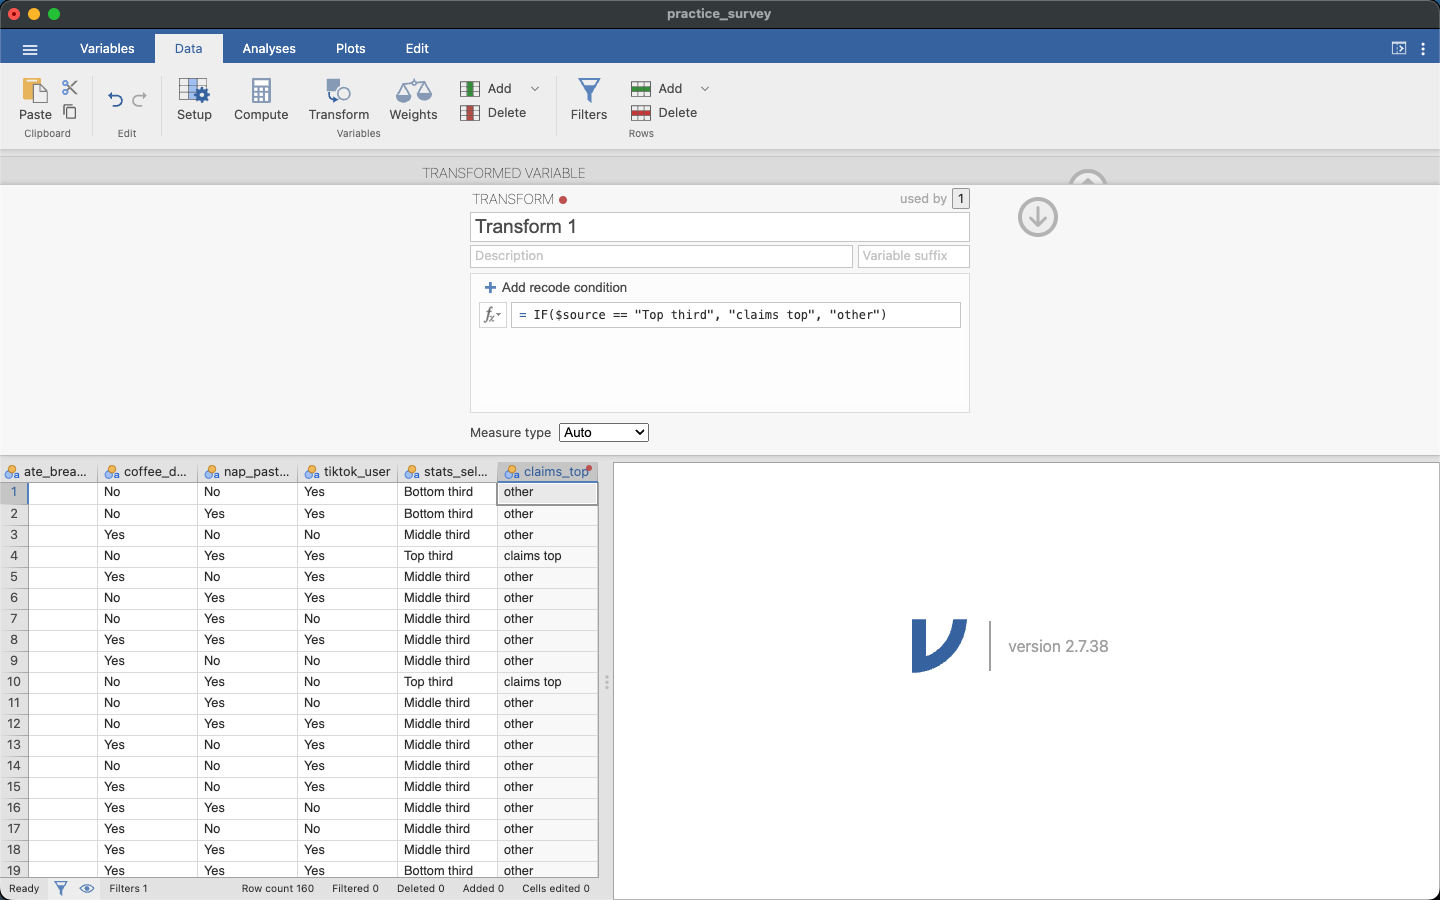
$source is the original column, so a student who answered “Top third” gets “claims top” and everyone else gets “other”.
Why the labels are “claims top” and “other”
The labels decide what Randomize counts. The Randomize module counts whichever level comes first alphabetically. It does not ask which level you care about, so the level you want counted has to sort first. Here claims top comes before other, so Randomize counts the students who claimed the top third, which is what we want.
If we had labeled them top and bottom, Randomize would have counted bottom, and every number afterward would have been \(1 - \hat{p}\) instead of \(\hat{p}\).
Step 4: Frequency table and bar plot
- Click the Analyses tab.
- Click Exploration, then Descriptives.
- Move
claims_topinto the Variables box. - Expand the Statistics options menu and uncheck the numeric statistics (N, Missing, Mean, Median, Std. deviation, Minimum, Maximum), since they are not meaningful for a categorical variable. Then check Frequency tables.
- Expand the Plots options menu and check Bar plot.
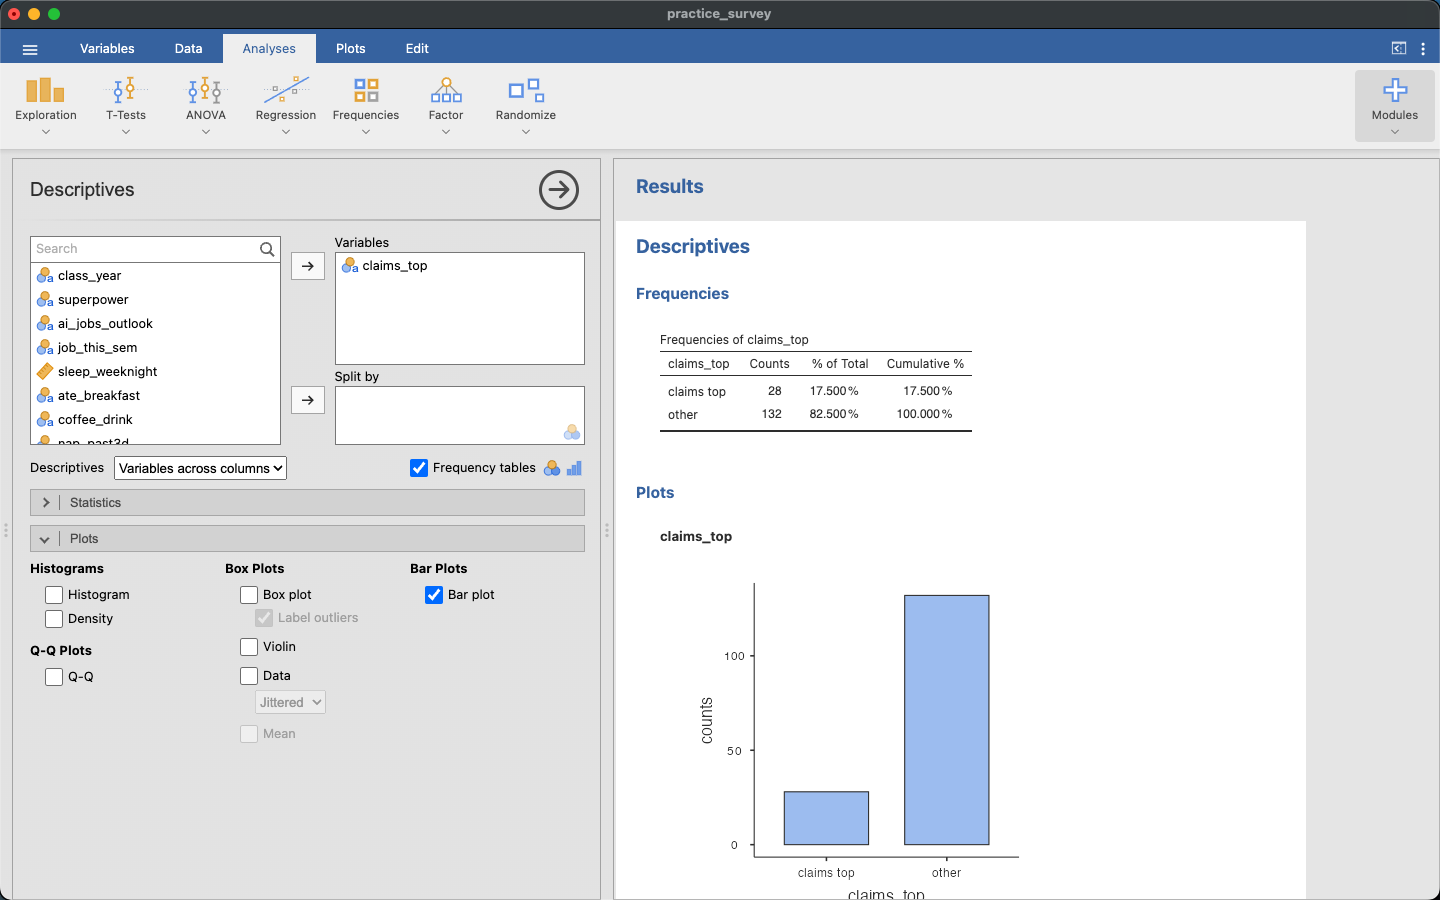
Read the two counts from the frequency table:
| claims_top | Counts | % of Total |
|---|---|---|
| claims top | 28 | 17.500 % |
| other | 132 | 82.500 % |
So \(n = 28 + 132 = 160\) and \(\hat{p} = 28/160 = 0.175\).
claims top should be the first row of the frequency table. Randomize uses the same ordering in the next step, so this row order is your check that the recode came out right. If other is on top, go back to Step 3 and fix the labels.
Step 5: Run the test
- Click the Analyses tab, then Randomize, then Single Proportion - Hypothesis Test.
- Set the options to match the hypotheses:
| Option | Value | Why |
|---|---|---|
| Variable | claims_top |
the recoded variable, not the original |
| Test value | 0.333 |
\(H_0: p = 1/3\) |
| Alternative hypothesis | Less | \(H_A: p < 1/3\), since the question is about under-claiming |
| Number of simulated samples | 1000 |
enough to see the shape of the null distribution |
| Plot bootstrap proportions | Histogram | 1000 dots would overlap, so bin them |
Leave Values are counts, Show counts on plot, and Seed random number generator unchecked.
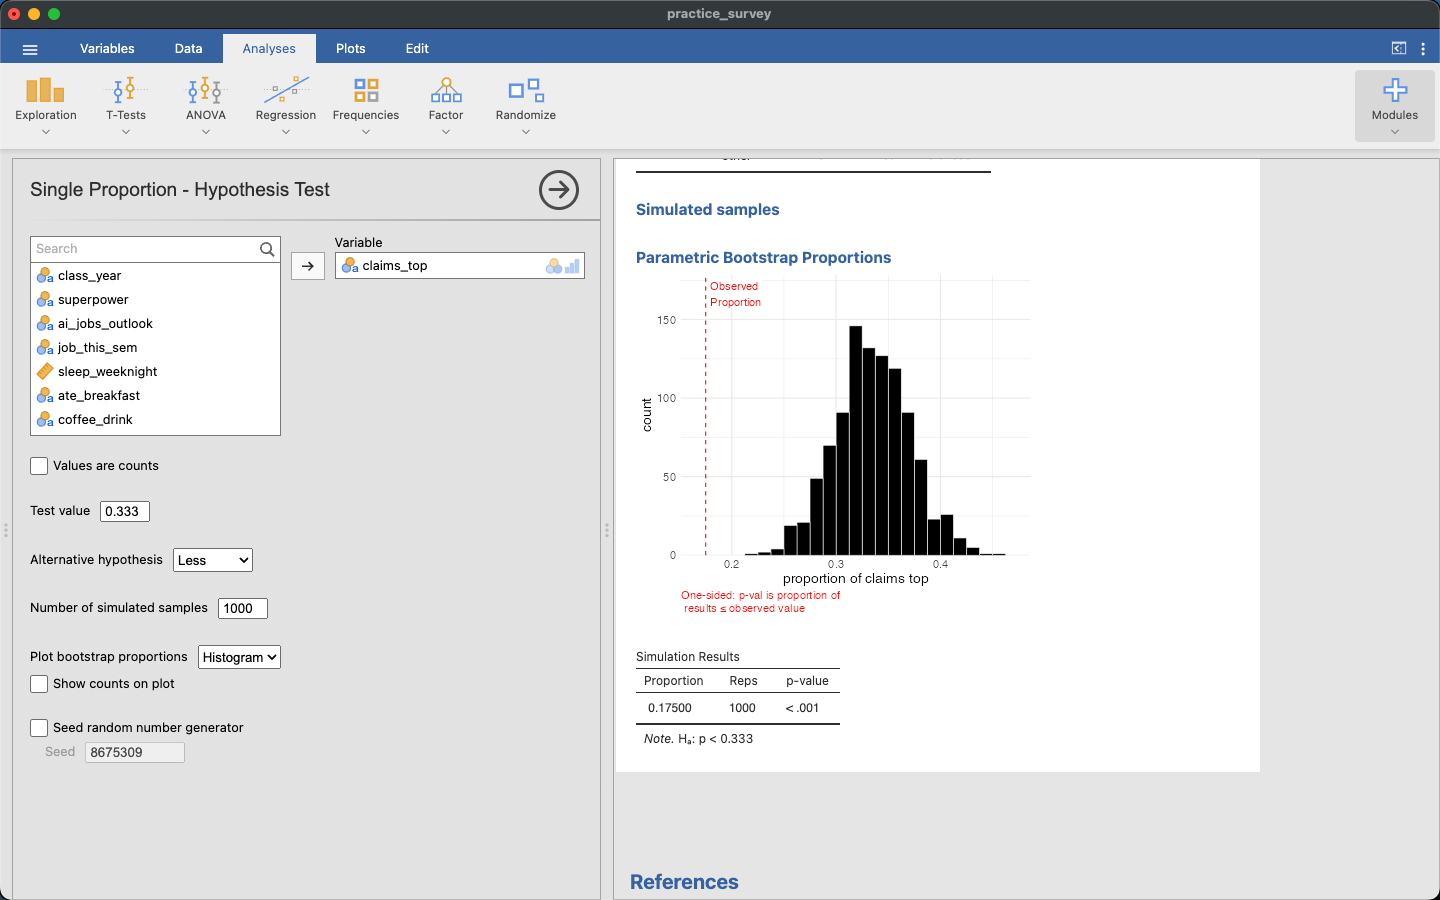
Step 6: Read the output
There are three things to find in the output.
The observed proportion. Under Original sample, the Summary Statistics table reports the count and proportion for each level. For claims top, that is 28 of 160, a proportion of 0.175. Check that this matches your frequency table from Step 4. If it does not, the levels are backwards.
The null distribution. Under Simulated samples, the histogram labeled Parametric Bootstrap Proportions shows 1000 simulated values of \(\hat{p}\) from a world where \(H_0\) is true, that is, where the true proportion is one third. It is centered near 0.333, and nearly all of it falls between about 0.24 and 0.43. The dashed red line labeled Observed Proportion marks our observed proportion, 0.175, to the left of every simulated value. The caption under the plot says what the p-value counts: the proportion of results ≤ the observed value. (When the observed value is farther out still, Jamovi draws a red arrow at the edge of the plot instead of a line.)
The p-value. The Simulation Results table reports Proportion 0.17500, Reps 1000, and p-value < .001. That means none of the 1000 simulated samples was as extreme as what we observed. With 1000 simulations, the most you can say is that the p-value is smaller than 1 in 1000.
Report this as \(p < 0.001\), not \(p = 0\). A p-value of exactly 0 would claim the result is impossible under \(H_0\), and the simulation cannot tell you that. It can only tell you that the result did not happen in 1000 tries.
The conclusion
At \(\alpha = 0.05\), we reject \(H_0\). There is strong evidence that fewer than one third of these students would place themselves in the top third, so this group appears to under-claim.
The same steps work for any yes/no question, or any question you can recode into two levels. Only the test value and the alternative hypothesis change, and those come from the research question.
If your numbers don’t match
| What you see | What went wrong |
|---|---|
| \(n\) is not 160 | Check the filter. It should mention only stats_self_rank. |
| \(\hat{p} = 0.825\) instead of 0.175 | The recode labels are backwards, so Randomize is counting other. Rename so the level you want sorts first alphabetically. |
other is the first row of the frequency table |
Same problem as above. |
| A p-value near 1 instead of near 0 | The Alternative hypothesis is set to Greater instead of Less. |
| A p-value that changes when you re-run | This is normal. The simulation draws new samples each time. Here it should stay well below 0.05. |
| No Randomize in the Analyses ribbon | The module is not installed. See the Jamovi Setup Guide. |
Practice on a second question
Run the same steps on a different question: have most of the students in the survey submitted coursework that was at least partly generated by AI? The survey column is ai_submit, answered Yes or No.
Everything is the same except the numbers and the direction:
- Filter:
ai_submit != NA - Recode:
IF($source == "Yes", "has", "never"). Sincehassorts beforenever, Randomize counts the students who have. - Test value
0.5, alternative hypothesis Greater (the claim is that most have, so \(H_A: p > 0.5\))
You should get \(n = 159\) and \(\hat{p} = 0.522\), with a simulated p-value around 0.32, well above 0.05, so we fail to reject \(H_0\). The data are consistent with a population proportion of one half. A majority in the sample is not, by itself, convincing evidence of a majority in the population.