Randomize Guide: Normal-Model Test for a Single Proportion
This guide goes through the normal-model test for a single proportion. You compute the standard error and Z by hand. Then Jamovi’s Model-Based Inference calculator turns Z into a p-value, one-sided or two-sided, and gives you the multiplier for a confidence interval at any level. The worked example compares a survey question with a national figure, and the steps are the same for any single proportion.
The worked example
The Pew Research Center reports that 62% of Americans aged 18 to 29 use TikTok. The practice survey asked the same thing: Do you have a TikTok account and use it at least occasionally? Do the students in the survey differ from that national figure?
The question doesn’t say “more” or “less,” only “differ,” so the test is two-sided:
\[H_0: p = 0.62 \qquad H_A: p \neq 0.62\]
where \(p\) is the proportion of students who use TikTok, in the group the survey represents.
What you need
- Jamovi 2.7.38 with the Randomize module installed. If Randomize isn’t in your Analyses ribbon, see the Jamovi Setup Guide.
- The practice survey file, practice_survey.csv. Open it with the hamburger menu (three lines, top left), Open, then Browse.
Step 1: Filter out the blanks
Open the survey file in Jamovi. Every survey question was optional, so first drop the students who skipped this one. Click the Data tab, then Filters, and in the formula box type
tiktok_user != NA
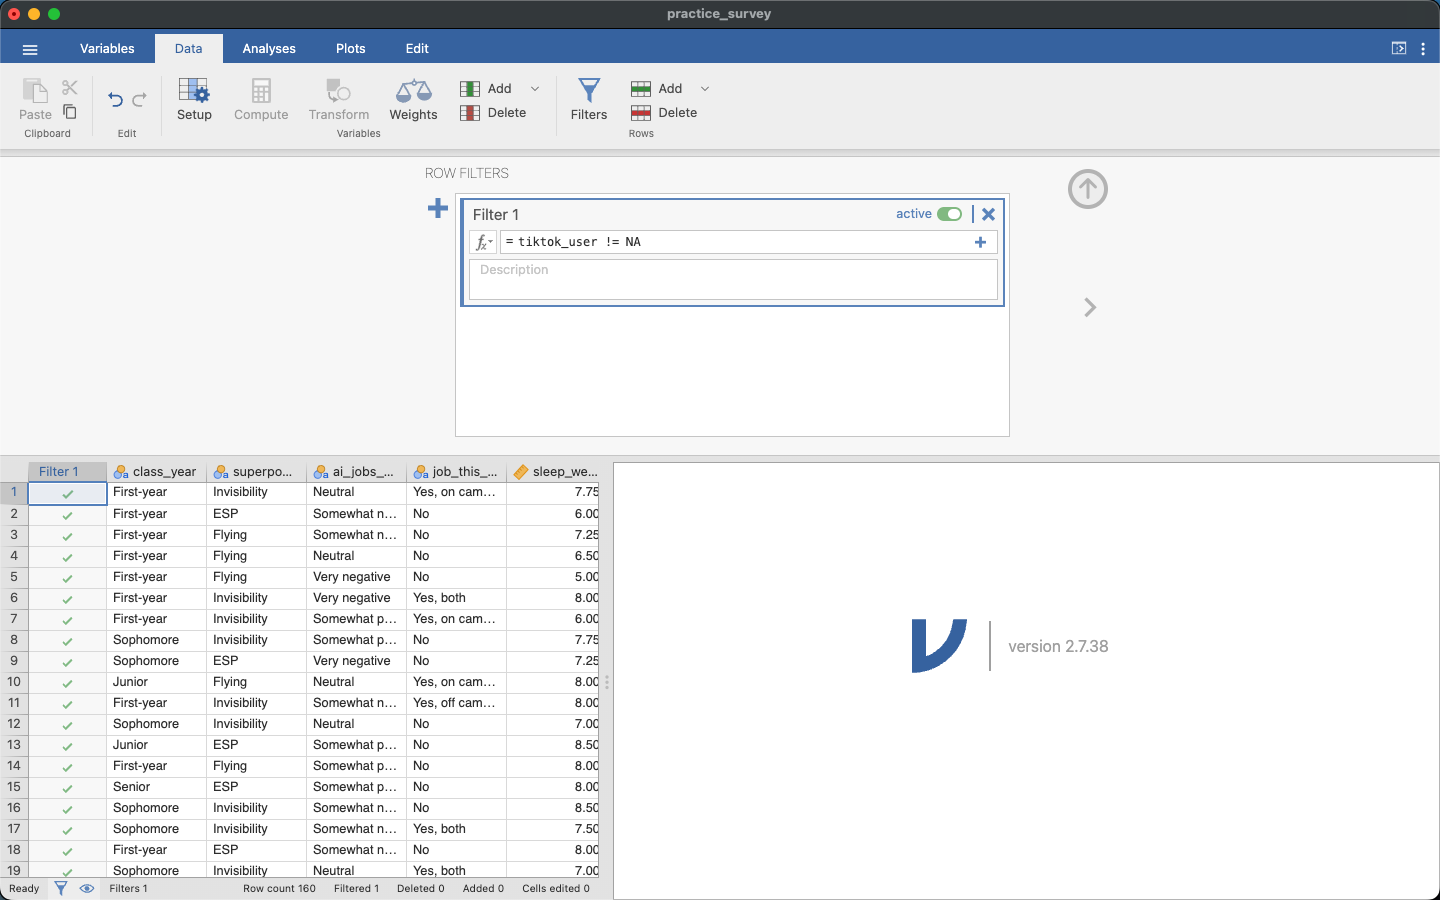
Check your work. The status bar should read Row count 160 and Filtered 1, so 159 students remain. That 159 is your \(n\).
Step 2: Get the count and p̂
Click Analyses → Exploration → Descriptives. Move tiktok_user into the Variables box and check Frequency tables.
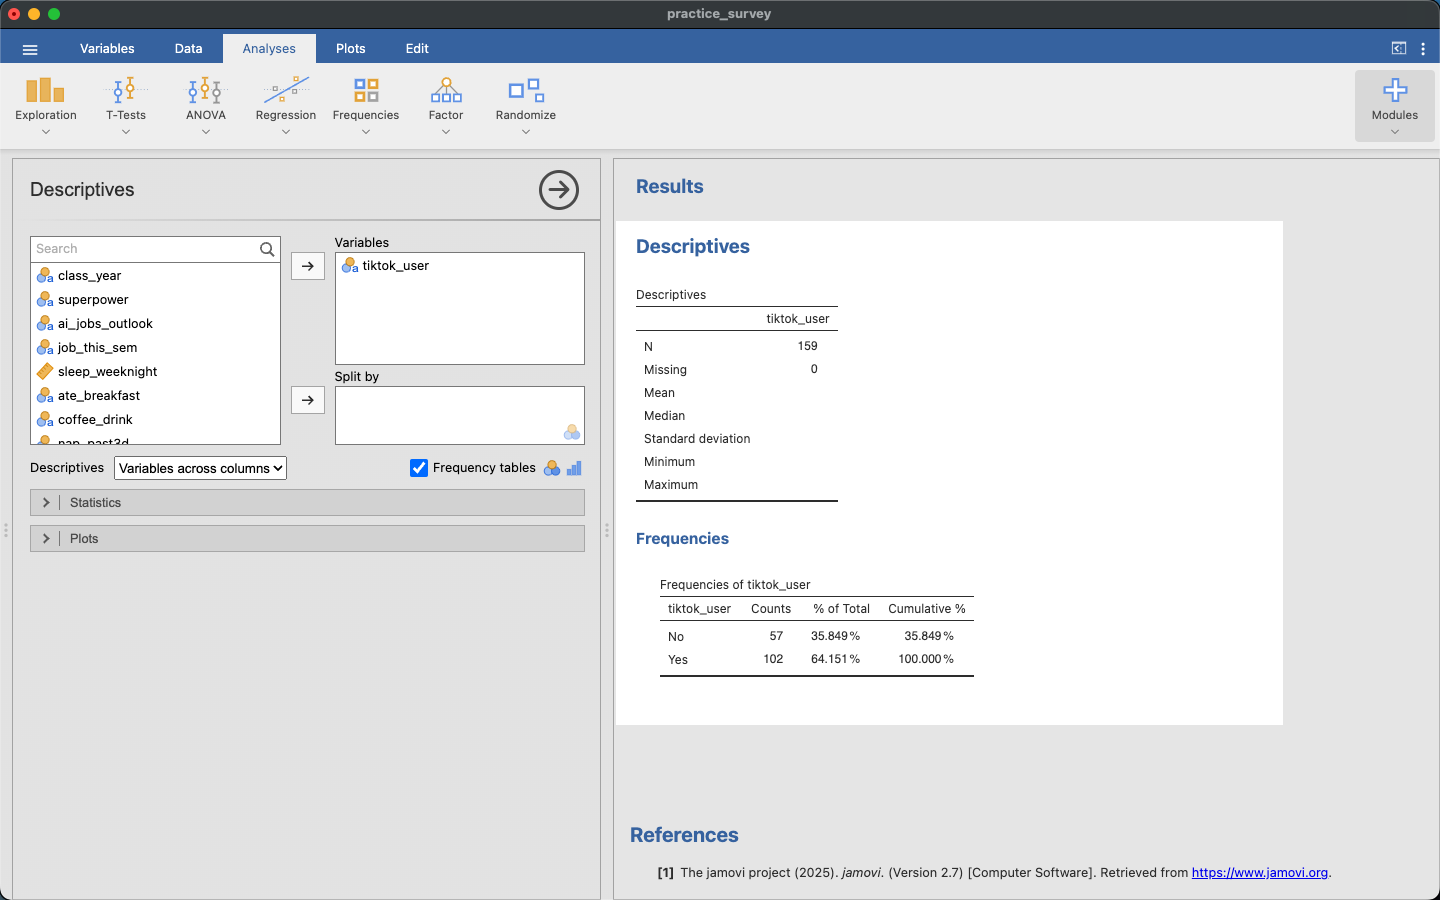
So \(\hat p = 102/159 = 0.6415\).
Step 3: Check the conditions, then SE and Z by hand
The success-failure condition uses the null value \(p_0 = 0.62\), not \(\hat p\).
- Success-failure: \(n p_0 = 159 \times 0.62 = 98.6\) and \(n(1 - p_0) = 159 \times 0.38 = 60.4\). Both are at least 10.
- Independence: one student’s answer doesn’t affect another’s.
Then compute the standard error under \(H_0\) and the test statistic:
\[SE_0 = \sqrt{\frac{p_0(1-p_0)}{n}} = \sqrt{\frac{0.62 \times 0.38}{159}} = 0.0385 \qquad Z = \frac{\hat p - p_0}{SE_0} = \frac{0.6415 - 0.62}{0.0385} = 0.56\]
The sample proportion is about 0.6 standard errors above the national figure. The calculator in the next steps tells you how unusual that is.
Step 4: Open Model-Based Inference
Click Analyses → Randomize → Model-Based Inference.
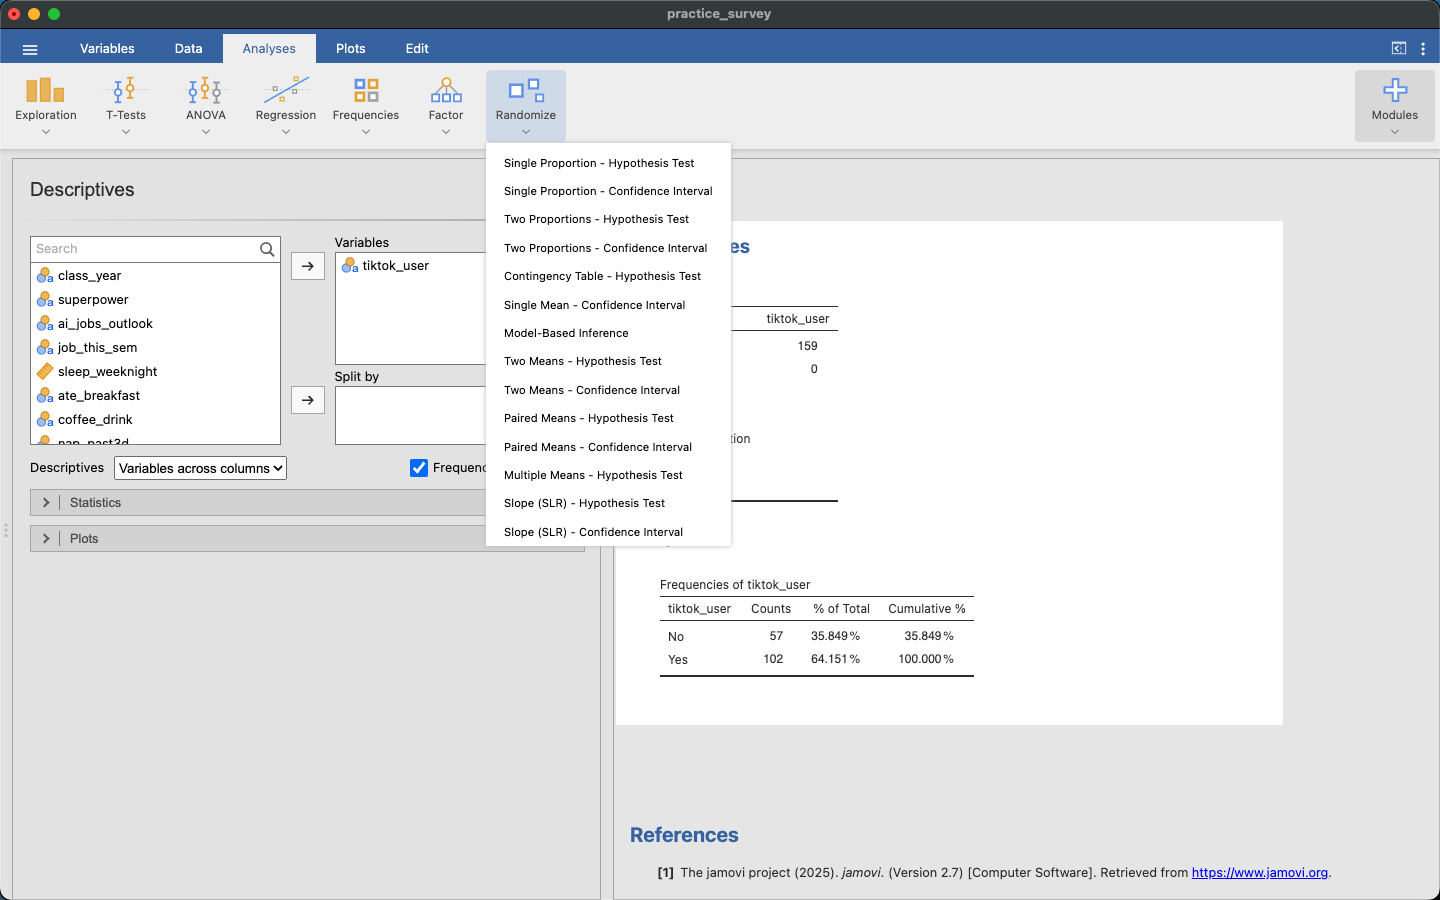
The other Randomize entries simulate from your data. This one does not use the data. It works from the normal curve and the Z you computed.
Step 5: The two-sided p-value
Set it up in this order:
- Distribution: leave Standard normal (Z) selected.
- Check Calculate area (p-value).
- Observed value: type your Z,
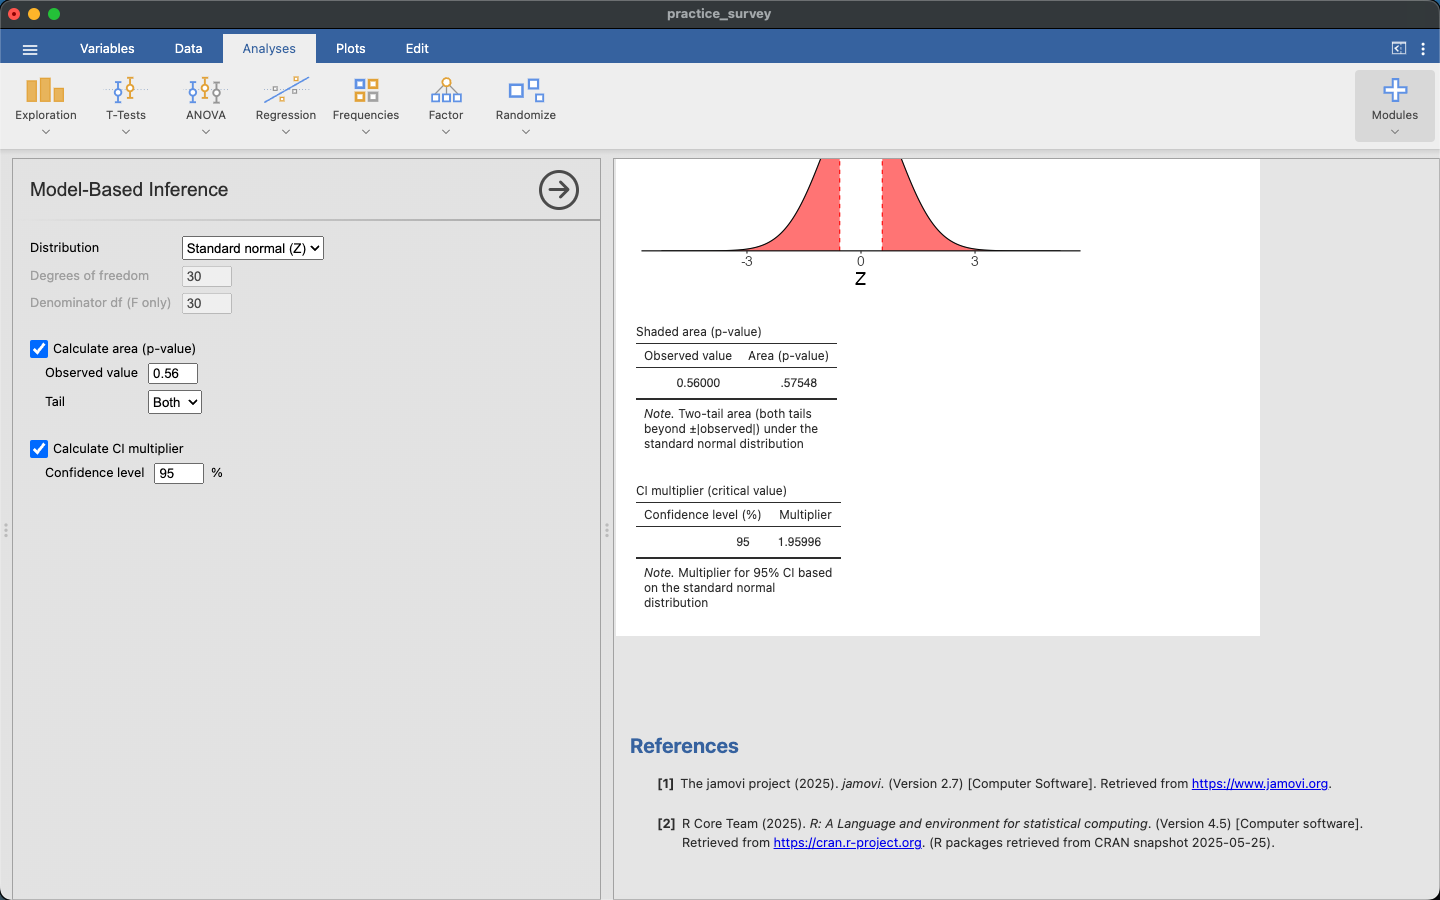
0.56. - Tail: choose Both. This makes the test two-sided. Jamovi shades both tails and adds their areas, so you don’t need to double anything by hand.
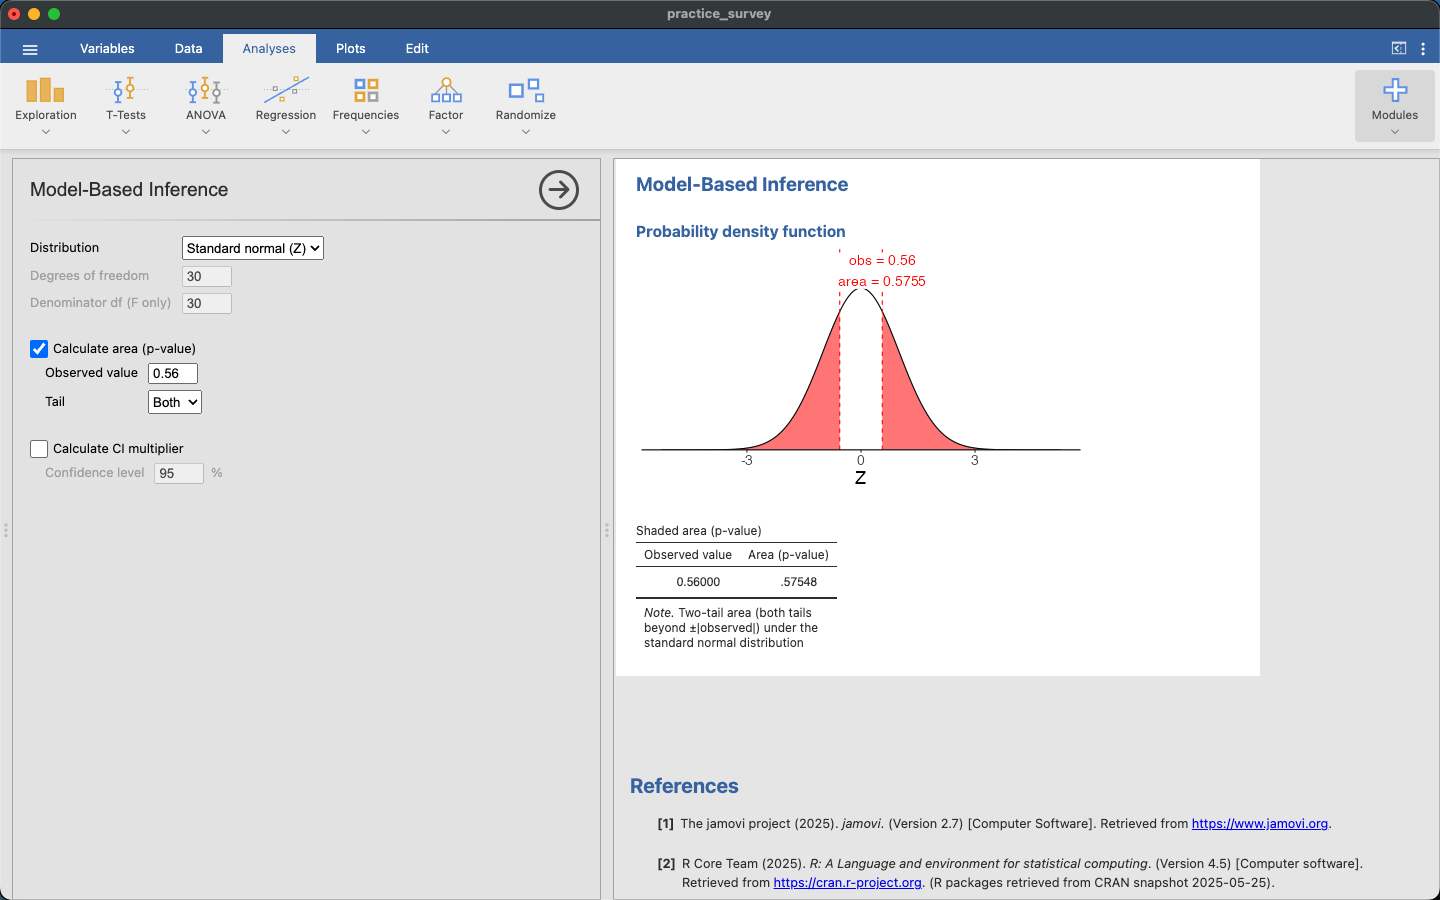
The Shaded area (p-value) table reports the observed value and the area, about 0.58.
Decision. At \(\alpha = 0.05\), a p-value of 0.58 is not small, so we fail to reject \(H_0\). The survey does not give convincing evidence that these students’ TikTok use differs from the 62% national figure for their age group.
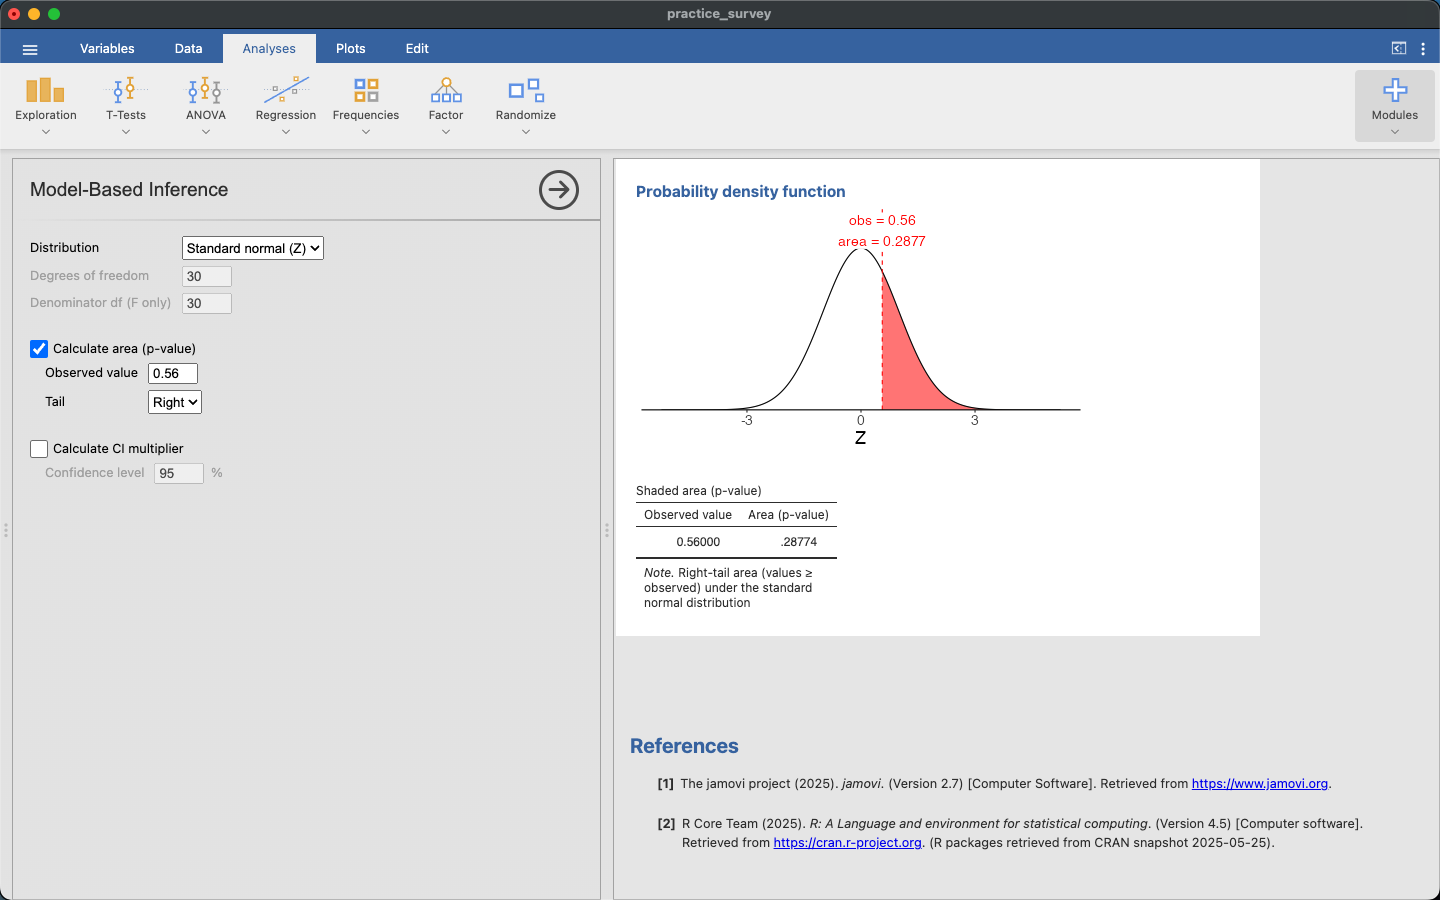
What “Both” does. If you switch Tail to Right, the area drops to about 0.29, which is the single tail beyond Z = 0.56. Both adds the matching left tail, which doubles it. If your alternative is one-sided (Hₐ: p > p₀ or p < p₀), choose the tail your alternative points to instead.
Step 6: The multiplier for a confidence interval
In the same dialog, check Calculate CI multiplier and leave the confidence level at 95.
The interval uses \(\hat p\) in the standard error, not \(p_0\):
\[SE = \sqrt{\frac{\hat p(1-\hat p)}{n}} = \sqrt{\frac{0.6415 \times 0.3585}{159}} = 0.0380 \qquad 0.6415 \pm 1.96 \times 0.0380 \;=\; 0.567 \text{ to } 0.716\]
We are 95% confident that between about 57% and 72% of the students the survey represents use TikTok. The national figure, 0.62, is inside the interval, which agrees with failing to reject at 0.05. If you type 90 or 99 into the confidence-level box, the multiplier changes to 1.645 or 2.576, and the interval narrows or widens with it.
If something looks off
| What you see | What’s usually going on |
|---|---|
| The p-value is tiny when you expected it to be large (or vice versa) | Check the sign and size of Z. A typo in the observed value is the usual cause |
| Your p-value is exactly half a classmate’s | One of you has Tail on Right or Left and the other on Both. Both is two-sided |
The area is written like 6.3342e-5 |
That’s scientific notation for 0.000063. Z is far out in the tail, past about 3.3. Report it as p < 0.001 |
| Success-failure fails | You used p̂ instead of p₀, or n is small. Recheck with p₀. If it still fails, the normal model isn’t appropriate here |
| The multiplier isn’t 1.96 | The confidence level box isn’t 95. That’s fine if you meant it |