Jamovi Guide: Expected Counts and X²
This guide builds on the two categorical variables guide. The table now has three rows, and Jamovi adds the expected counts, the counts we would see in each cell if the two variables were not related. You work a few expected counts and cell contributions by hand, then check that Jamovi’s χ² value is the sum of all of them. The example uses the practice survey data, so if you follow along with that file open you should see the same numbers.
The worked example
The survey asked which superpower you would choose (superpower: ESP, Flying, or Invisibility) and your year in college (class_year).
Research question: among the students in the survey, does the superpower they would choose depend on their year in college?
- Explanatory variable: year in college, recoded into three levels: first-year, sophomore, and upperclass (juniors and seniors together).
- Response variable: superpower, with three levels.
What you need
- Jamovi 2.7.38. Everything here is in Jamovi itself.
- The practice survey file, practice_survey.csv. Open it with the hamburger menu (three lines, top left), Open, then Browse.
Step 1: Filter
Two students listed their year as Non-degree seeking. That level is too small to be its own group, so we leave them out, along with anyone who skipped the superpower question.
Click the Data tab, then the Filters icon.
In the formula box, type:
class_year != "Non-degree seeking" and superpower != NA
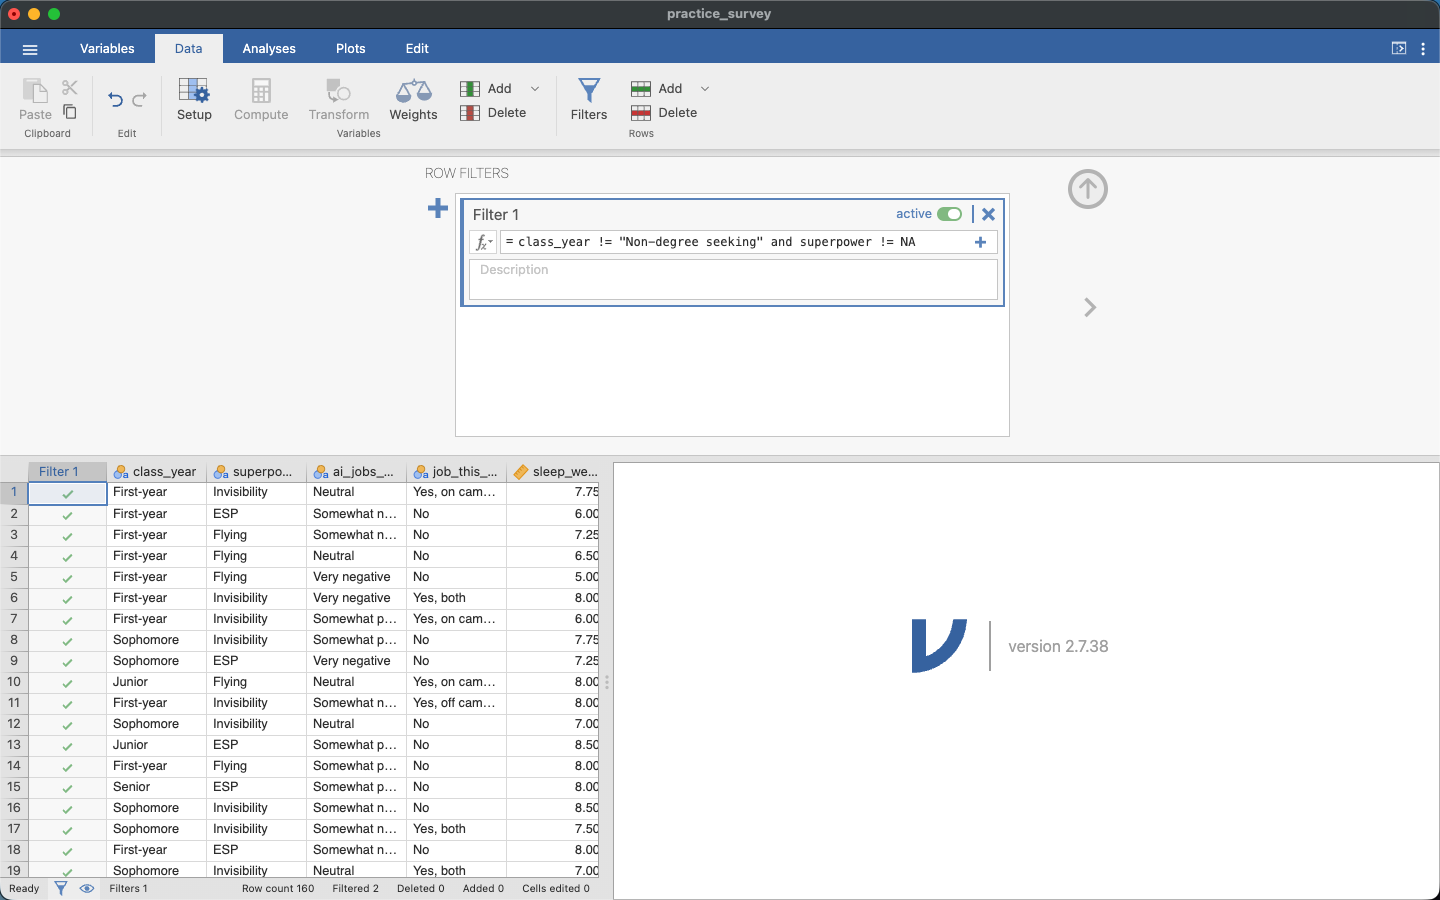
Check your work. The status bar should read Row count 160 and Filtered 2, so 158 students remain. Nobody skipped the superpower question.
Step 2: Recode year into three levels
Click the Variables tab, type
class_yearin the search box, and check its box so it is the only variable selected.Click Transform. Change the name of the new variable to
year3.In the pull-down labeled using transform, choose Create New Transform….
In the \(f_x\) box, type:
IF($source == "First-year", "first-year", IF($source == "Sophomore", "sophomore", "upperclass"))
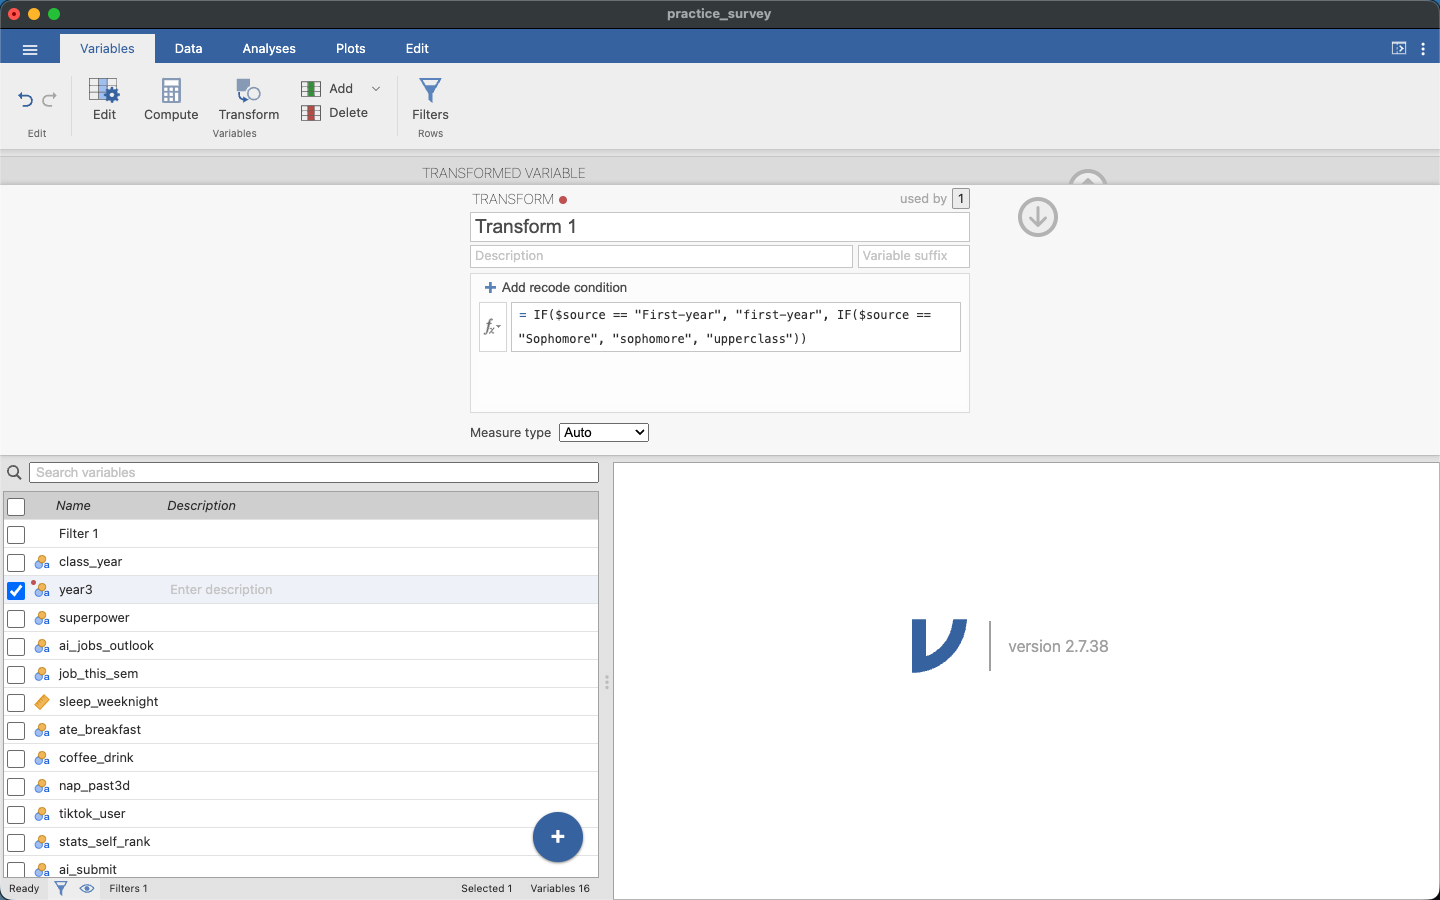
Two IFs, one inside the other, make three levels. The first checks for First-year; if the answer is no, the second checks for Sophomore; anything left over is upperclass. The non-degree students are already filtered out, so they don’t end up in upperclass.
Step 3: The table with expected counts
- Click the Analyses tab, then Frequencies, then Independent Samples.
- Put the explanatory variable,
year3, in Rows. Put the response,superpower, in Columns. - Expand Cells. Under Counts, check Expected counts. Under Percentages, check Row.
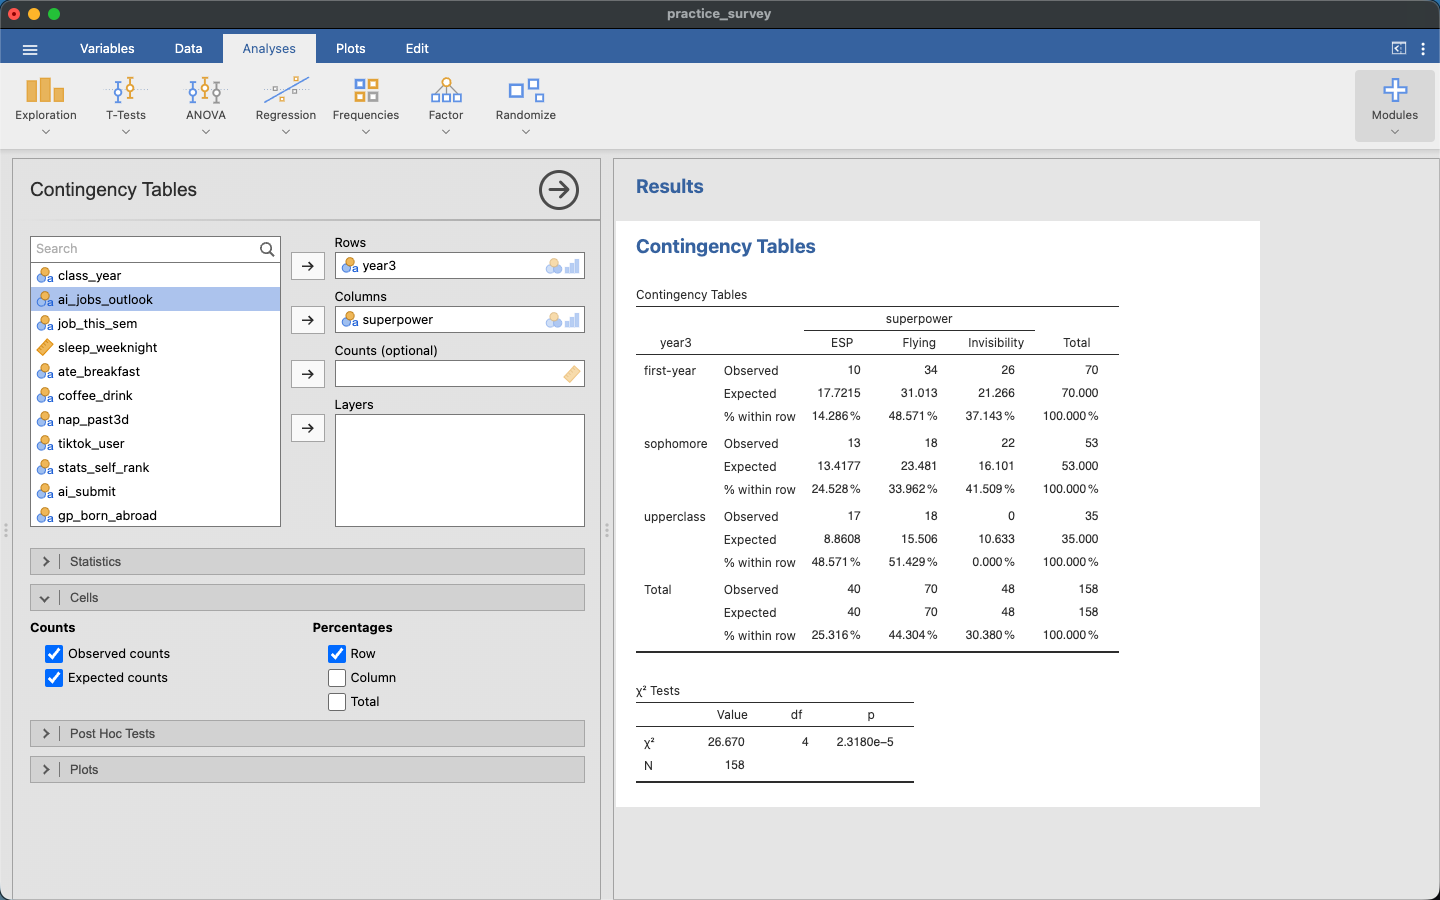
The table, with expected counts in parentheses:
| year3 | ESP | Flying | Invisibility | Total |
|---|---|---|---|---|
| first-year | 10 (17.722) | 34 (31.013) | 26 (21.266) | 70 |
| sophomore | 13 (13.418) | 18 (23.481) | 22 (16.101) | 53 |
| upperclass | 17 (8.861) | 18 (15.506) | 0 (10.633) | 35 |
| Total | 40 | 70 | 48 | 158 |
In the row percentages, 37% of first-years and 42% of sophomores chose Invisibility, and none of the 35 upperclass students did. Upperclass students chose ESP more often (49%) than first-years (14%).
Below the table is a χ² Tests table with a Value, a df, and a p. For now we use only the Value. The df and p are for the chi-square test.
Step 4: Expected counts by hand
If year and superpower were not related, every year would choose the three superpowers in the same proportions as the whole group. The expected count for a cell is
\[E = \frac{\text{row total} \times \text{column total}}{\text{grand total}}.\]
Here are two cells.
- first-year, Flying: \(E = \dfrac{70 \times 70}{158} = 31.01\). The observed count is 34, close to what we would expect.
- upperclass, Invisibility: \(E = \dfrac{35 \times 48}{158} = 10.63\). The observed count is 0.
Expected counts can have decimals. Only the observed counts have to be whole numbers.
Step 5: Cell contributions and X²
Each cell contributes
\[\frac{(O - E)^2}{E}\]
where \(O\) is the observed count and \(E\) the expected count. For the two cells above:
- first-year, Flying: \(\dfrac{(34 - 31.01)^2}{31.01} = 0.29\)
- upperclass, Invisibility: \(\dfrac{(0 - 10.63)^2}{10.63} = 10.63\)
The chi-square statistic, \(X^2\), is the sum of the contributions from all the cells, nine in this table:
| year3 | ESP | Flying | Invisibility |
|---|---|---|---|
| first-year | 3.36 | 0.29 | 1.05 |
| sophomore | 0.01 | 1.28 | 2.16 |
| upperclass | 7.48 | 0.40 | 10.63 |
\[X^2 = 3.36 + 0.29 + 1.05 + 0.01 + 1.28 + 2.16 + 7.48 + 0.40 + 10.63 = 26.66\]
Check your work. Jamovi’s χ² Value is 26.670. The rounded contributions add to 26.66, which is close enough.
Reading the contributions
Two cells in the upperclass row contribute 10.63 and 7.48, about two thirds of \(X^2\) between them. Upperclass students chose Invisibility far less often and ESP far more often than we would expect if year and superpower were not related.
Because each squared gap is divided by \(E\), the same gap counts for more in a cell with a small expected count. A gap of 10 with an expected count of 11 contributes about 9; a gap of 10 with an expected count of 60 contributes about 1.7. To guess which cells contribute most before working them out, compare each gap with the size of the expected count.
A large \(X^2\) means the table is far from what independence predicts. Whether it is larger than chance alone would give is a question for the chi-square test, which uses the chi-square distribution to find a p-value.
If your numbers don’t match
| What you see | What went wrong |
|---|---|
| \(N = 160\) in the χ² Tests table | The filter isn’t active. Check that its toggle is green |
| Juniors and seniors in separate rows | The table is using class_year instead of year3 |
upperclass has 37 students |
The filter is missing, so the two non-degree students went into upperclass |
| No Expected line in the table | Under Cells, check Expected counts |
| The percentages add to 100 down a column | Under Cells you checked Column instead of Row |
| Your \(X^2\) is off by one cell’s worth | A cell was left out. Count: a 3×3 table has nine contributions |
Practice on a second question
Does how students see AI’s effect on jobs depend on their year in college? The survey column is ai_jobs_outlook, with five levels from Very negative to Very positive. Keep the year3 recode, and add ai_jobs_outlook != NA to the filter (nobody skipped it, so 158 remain).
- Rows
year3, Columnsai_jobs_outlook, with expected counts and row percentages. - The table has 15 cells, so \(X^2\) has 15 contributions.
- sophomore, Very positive: 5 observed, \(E = \dfrac{53 \times 7}{158} = 2.35\), contribution \(\dfrac{(5 - 2.35)^2}{2.35} = 3.00\). This is the biggest contributor.
- first-year, Very positive: 1 observed, \(E = \dfrac{70 \times 7}{158} = 3.10\), contribution 1.42.
You should get \(X^2 = 7.372\). Most of it (4.62 of the 7.37) comes from the Very positive column, where 9% of sophomores answered Very positive against 1% of first-years and 3% of upperclass students. Only 7 students in all gave that answer. Look at the expected counts in that column, too. All three are under 5, and that matters for the chi-square test.