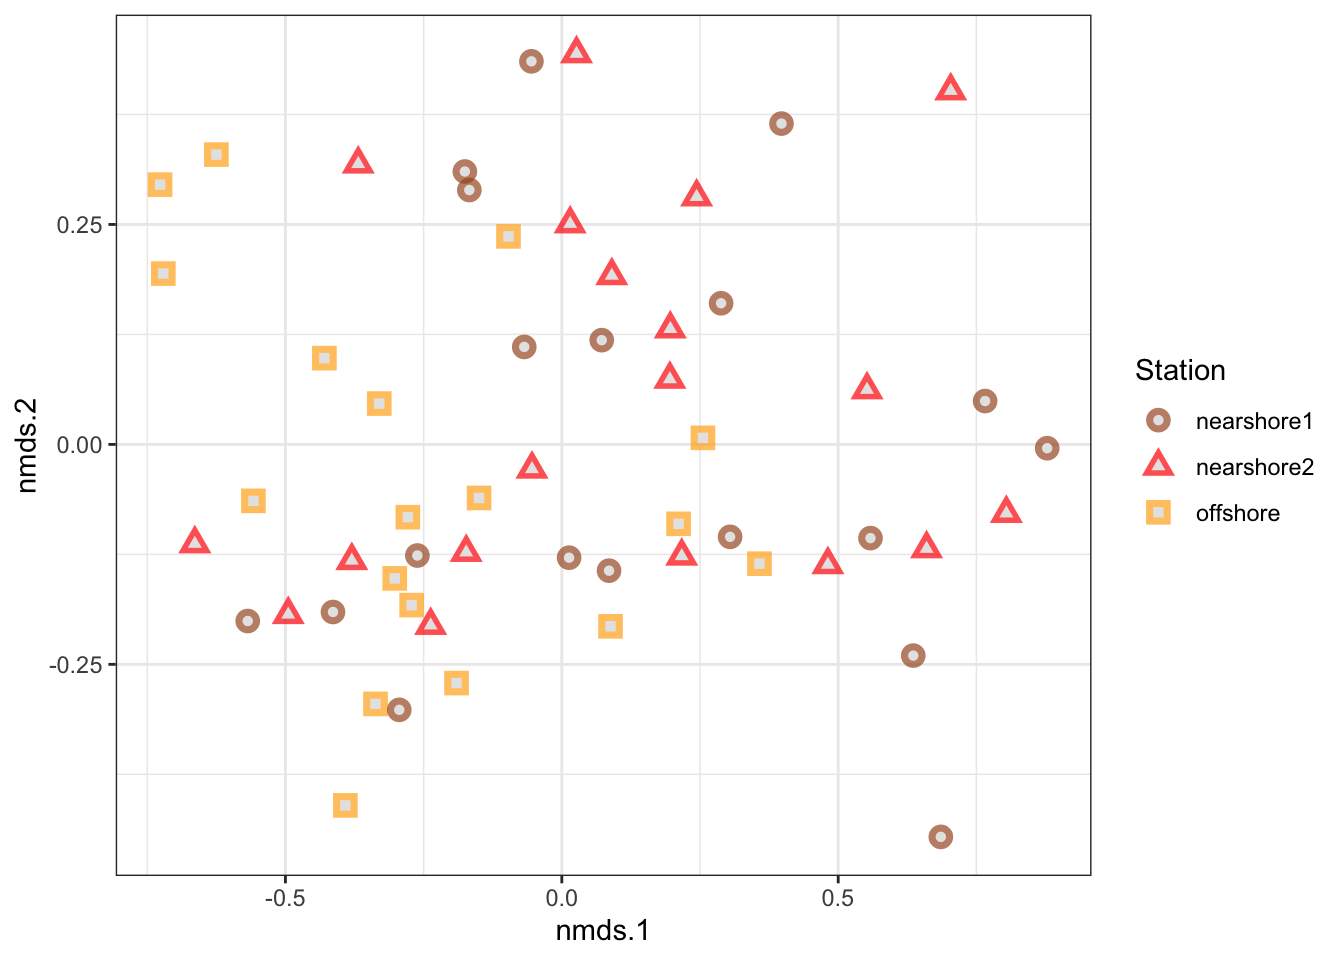
PERMANOVA stands for Purmutational Multivariate Analysis of Variance. It shares several things in common with traditional Analysis of Variance (ANOVA). Broadly, like traditional ANOVA, PERMANOVA is used to analyze differences between groups. We will use PERMANOVA to compare bacterial communities between groups. We can define the groups however we like. For example, we can group samples by site, site type, environmental conditions, etc. In this tutorial we will compare bacterial communities between the three sampling stations in the Lake Erie data set.
PERMANOVA uses a pseudo F statistic as a test statistic. Like the standard F statistic, the psuedo F statistic compares a measure of the variability between groups to the variability within groups. Large values of the pseudo F statistic correspond with stronger evidence of a difference between groups.
The pseudo F statistic measures variation between and within groups using a specified dissimilarity measure (e.g., Bray-Curtis). For example, variation within a single group is measured by adding all of the pairwise squared distances between points in the group using the chosen dissimilarity measure. Thus, PERMANOVA is used to test the null hypothesis that groups have the same centroids in the space determined by the choice of dissimilarity measures. In comparison, traditional ANOVA tests the null hypothesis that groups have the same mean.
In traditional ANOVA the distribution of sample statistics under the null hypothesis (the null distribution) is approximated by an F distribution, and a p-value is computed by comparing the observed value of the F statistic to this distribution (a theory-based approach). In PERMANOVA, the null distribution is created by permuting the data (a simulation-based approach). Samples are randomly shuffled between groups to simulate the null hypothesis, and a pseudo F statistic is computed for the simulation. This is repeated many times to determine the distribution of pseudo F statistics, assuming the null hypothesis is true (a simulation-based null distribution). The observed F statistic is compared to this distribution to determine a p-value.
Two advantages of PERMANOVA over traditional ANOVA approaches are that it is distance-based, so we can base it on any dissimilarity measure that we want, and that it is simulation-based so that we do not need to be concerned about violating validity some of the conditions that are usually associated with theory-based analyses.
One limitation of PERMANOVA is that it can be sensitive to heterogeneity in dispersion between groups. This means that a significant PERMANOVA test could simply indicate a difference in the amount of variability in different groups, not a difference in group centroids. A PERMDISP test can be used in combination with PERMANOVA to determine if there is significant heterogeneity in group dispersions. If the test is not significant it suggests that a significant PERMANOVA test is detecting a difference in group centroids rather than dispersions.
A PERMANOVA test can be performed in R using the adonis2 function in the vegan package. The analysis can be based on any dissimilarity matrix that can be computed using the vegdist function. We first encountered the vegdist function in Tutorial 6 when we explored unconstrained ordination analyses of the Lake Erie bacterial community data. A PERMDISP test can be performed using the betadisper function and associated permutest method in vegan.
Let’s start by cleaning up our work space and loading the required packages.
rm(list =ls())gc()
          used (Mb) gc trigger (Mb) limit (Mb) max used (Mb)
Ncells  579266 31.0    1320328 70.6         NA   669434 35.8
Vcells 1064632  8.2    8388608 64.0     102400  1851753 14.2
library(tidyverse)
── Attaching core tidyverse packages ──────────────────────── tidyverse 2.0.0 ──
✔ dplyr     1.1.3     ✔ readr     2.1.4
✔ forcats   1.0.0     ✔ stringr   1.5.0
✔ ggplot2   3.4.3     ✔ tibble    3.2.1
✔ lubridate 1.9.2     ✔ tidyr     1.3.0
✔ purrr     1.0.2
── Conflicts ────────────────────────────────────────── tidyverse_conflicts() ──
✖ dplyr::filter() masks stats::filter()
✖ dplyr::lag()    masks stats::lag()
ℹ Use the conflicted package (<http://conflicted.r-lib.org/>) to force all conflicts to become errors
library(vegan)
Loading required package: permute
Loading required package: lattice
This is vegan 2.6-4
Let’s load the clean data sets. We will read in the version of the metadata that includes the ordination coordinates. Since we have already computed and saved the Bray-Curtis dissimilarity matrix for the Erie data, we can simple read it in instead of creating it again. We do not need to use the full data set.
Let’s make sure that the samples are the same and are ordered the same in the distance matrix and the metadata. For the dissimilartiy matrix the sample names are stored as “Labels”, an attribute of a dissimilarity matrix. We will print the sample IDs for the dissimilarity matrix and for the metadata. Then we will use the identical command to check to make sure they are the same and in the same order.
We will compare bacterial communities between sampling stations in the Lake Erie data. The PERMANOVA test is significant (p-value = 0.004).
set.seed(8675309)adonis2(erie_dist ~ Station, data = erie_meta)
Permutation test for adonis under reduced model
Terms added sequentially (first to last)
Permutation: free
Number of permutations: 999

adonis2(formula = erie_dist ~ Station, data = erie_meta)
         Df SumOfSqs      R2      F Pr(>F)
Station   2   0.6751 0.09564 2.8026  0.004 **
Residual 53   6.3836 0.90436
Total    55   7.0587 1.00000
---
Signif. codes:  0 '***' 0.001 '**' 0.01 '*' 0.05 '.' 0.1 ' ' 1
PERMDISP
The function betadispers measures the group dispersions, and permutest conducts the test of significance for the null hypothesis of no difference in dispersion between groups. The p-value (0.094) indicates that the difference between group dispersions is not statistically significant. This suggests that the PERMANOVA test is detecting a difference in group centroids rather than a difference in group dispersions.
beta <-betadisper(erie_dist, erie_meta$Station) # analysis of homogeneity of group dispersions for samplepermutest(beta) # conduct test (permutes model residuals) of null hypothesis of no difference in dispersion between groups
Permutation test for homogeneity of multivariate dispersions
Permutation: free
Number of permutations: 999

Response: Distances
          Df   Sum Sq   Mean Sq      F N.Perm Pr(>F)
Groups     2 0.025978 0.0129892 2.4091    999  0.094 .
Residuals 53 0.285766 0.0053918
---
Signif. codes:  0 '***' 0.001 '**' 0.01 '*' 0.05 '.' 0.1 ' ' 1
Comparison with NMDS plot
Based on the results of the PERMANOVA we can conclude that there is a statistically significant difference between the centroids of the bacterial communities between stations. Can we see evidence of this difference in a two-dimensional NMDS plot? Are all stations different from each other? Is one station different from the others?