Statistical Process Control
Additional Topic
Math 219
What is statistical process control (SPC)?
Unlike other topics in this course it is not considered an inference test
However, SPC determines if variability is consistent with the process
- The normal variability in a process is referred to as “common cause” variability and any other source of variability is referred to as “special cause”
- Common cause is due to random variation in the process, like the \(null\) hypothesis in statistical inference
- Special cause is due to variation caused by something other than the process, like the \(alternative\) hypothesis
Data for SPC
To control a process data is collected from process samples
Both categorical and quantitative variables are used
- Numerical variables are called variable characteristics
- Categorical variables are attribute characteristics
Fixing the number of samples collected is important in SPC
- Too many samples can cost time and resources
- Too few samples gives too much variability in control data
Determining the state of a process
- If process variation is from common cause
- The process is considered in-control
- But if process variation is due to special cause
- The process is considered out-of-control
- To determine the state of a process
- We typically use a control chart
Control chart for attribute characteristics
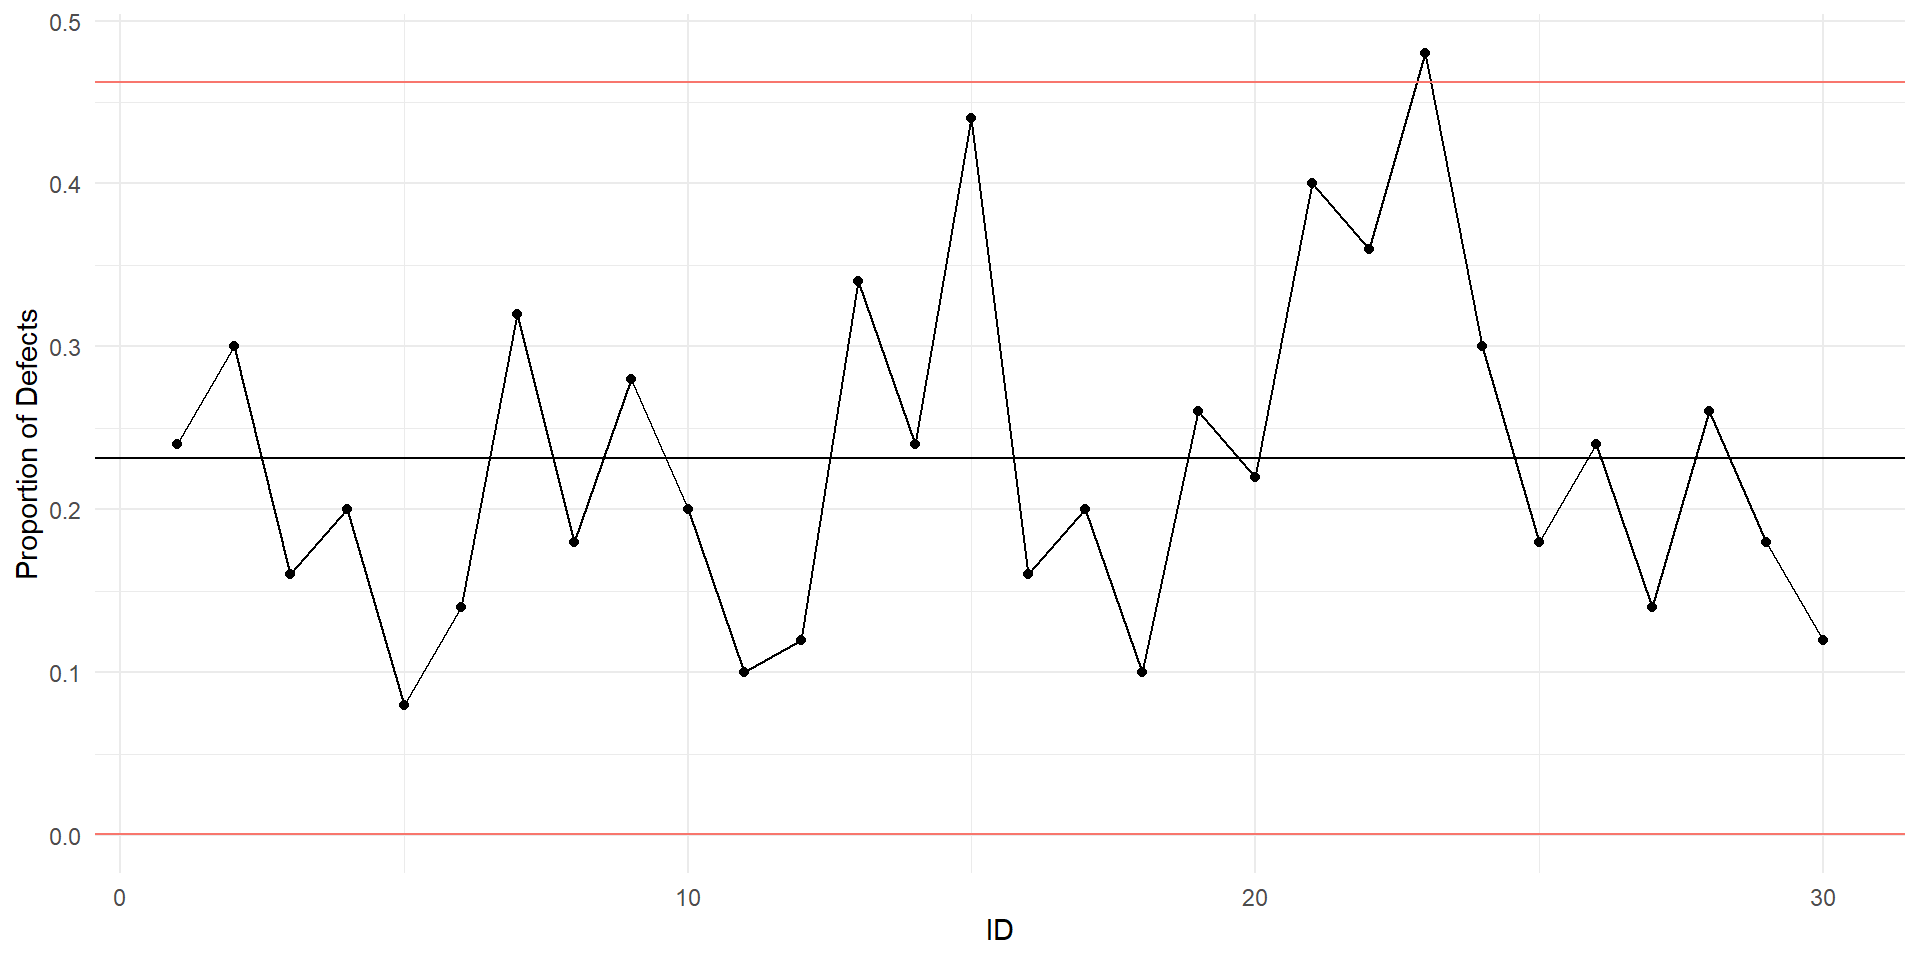
- This control chart is called a p-chart because it is
- Based on the proportion of non-conforming parts
![]()
p-chart for silicon chip defects
- The middle line on the chart is
- the long-run or population proportion
- p for the process when it is in control
- The upper control line (UCL) and lower control line (LCL)
- Are 3 standard deviations (SD) above p
- And 3SD below p1
Probability process is in- or out-of-control
- The risk of getting an out-of-control response
- From an in-control process is very small
- Our model for a proportion is the normal distribution
- The probability of getting a sample 3SD above or below the mean
- From common cause (random chance) is 0.0027 or 0.27%
- So, 99.7% of the time an in-control process should give
- An in-control response or sample
Attribute characteristics control chart data
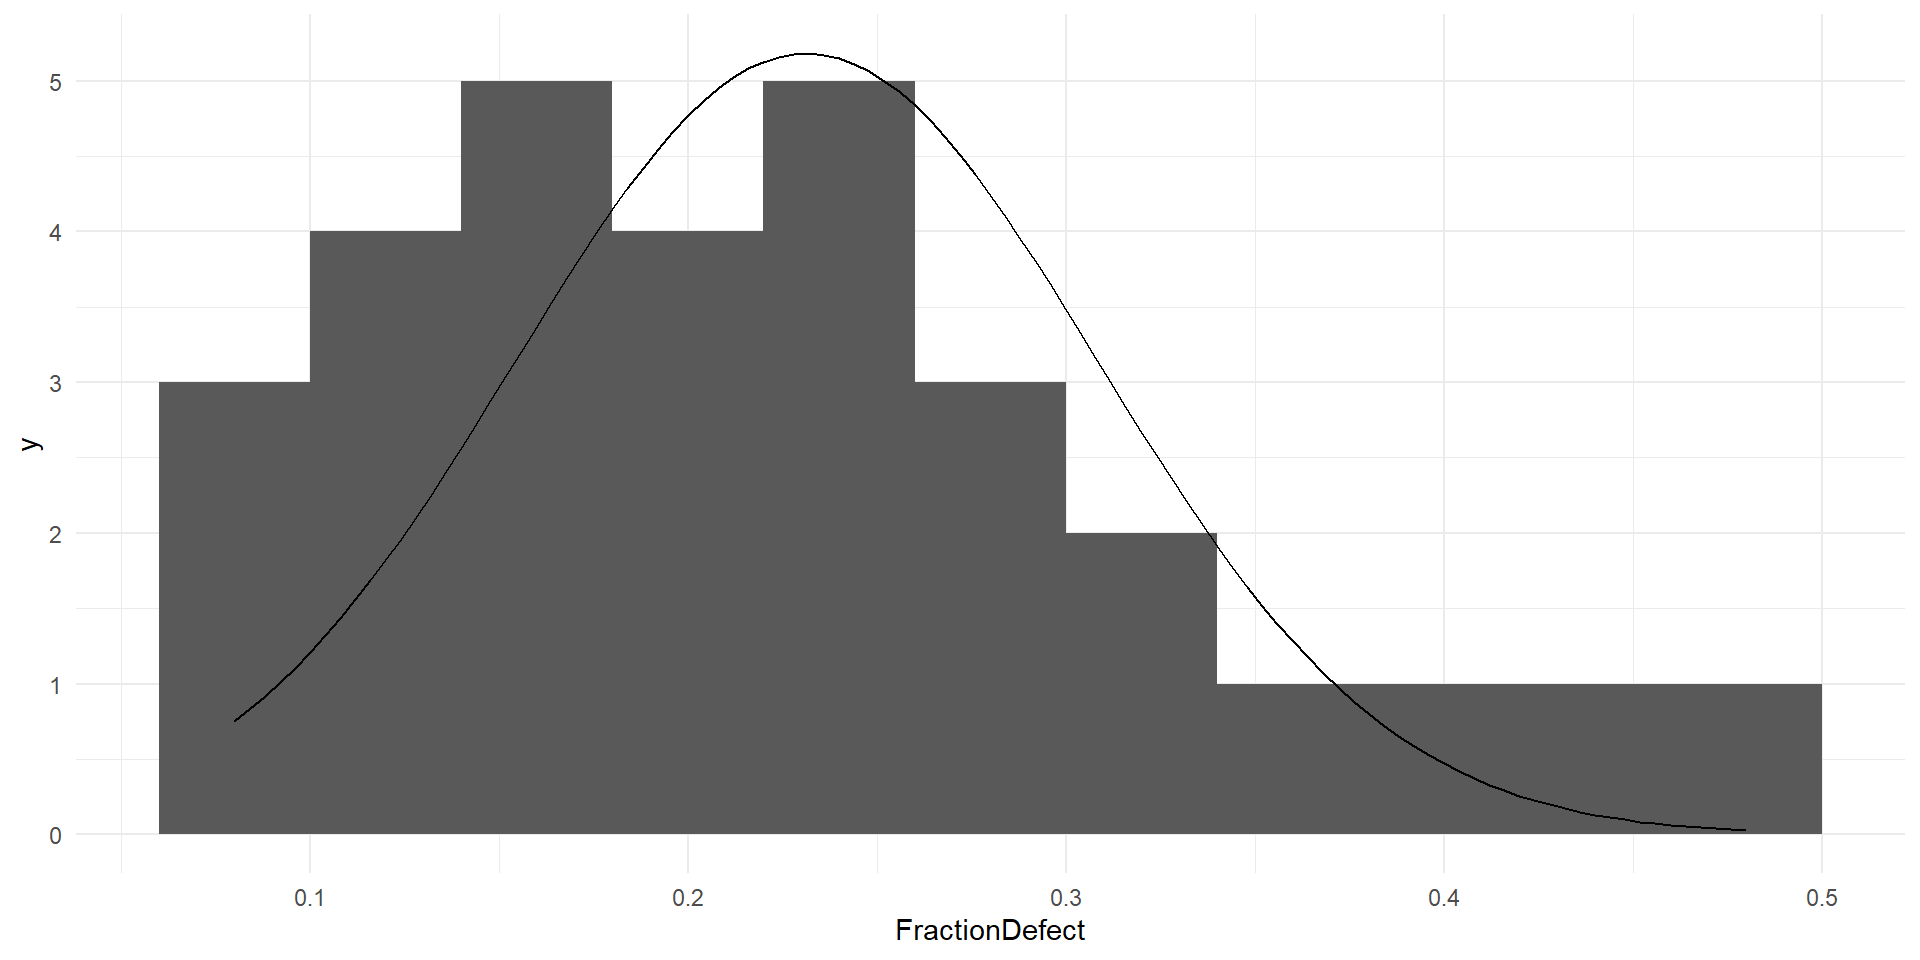
- We can view the data for the attribute characteristics
- As a histogram and evaluate normality assumption
![]()
histogram of defects
Variable characteristics data
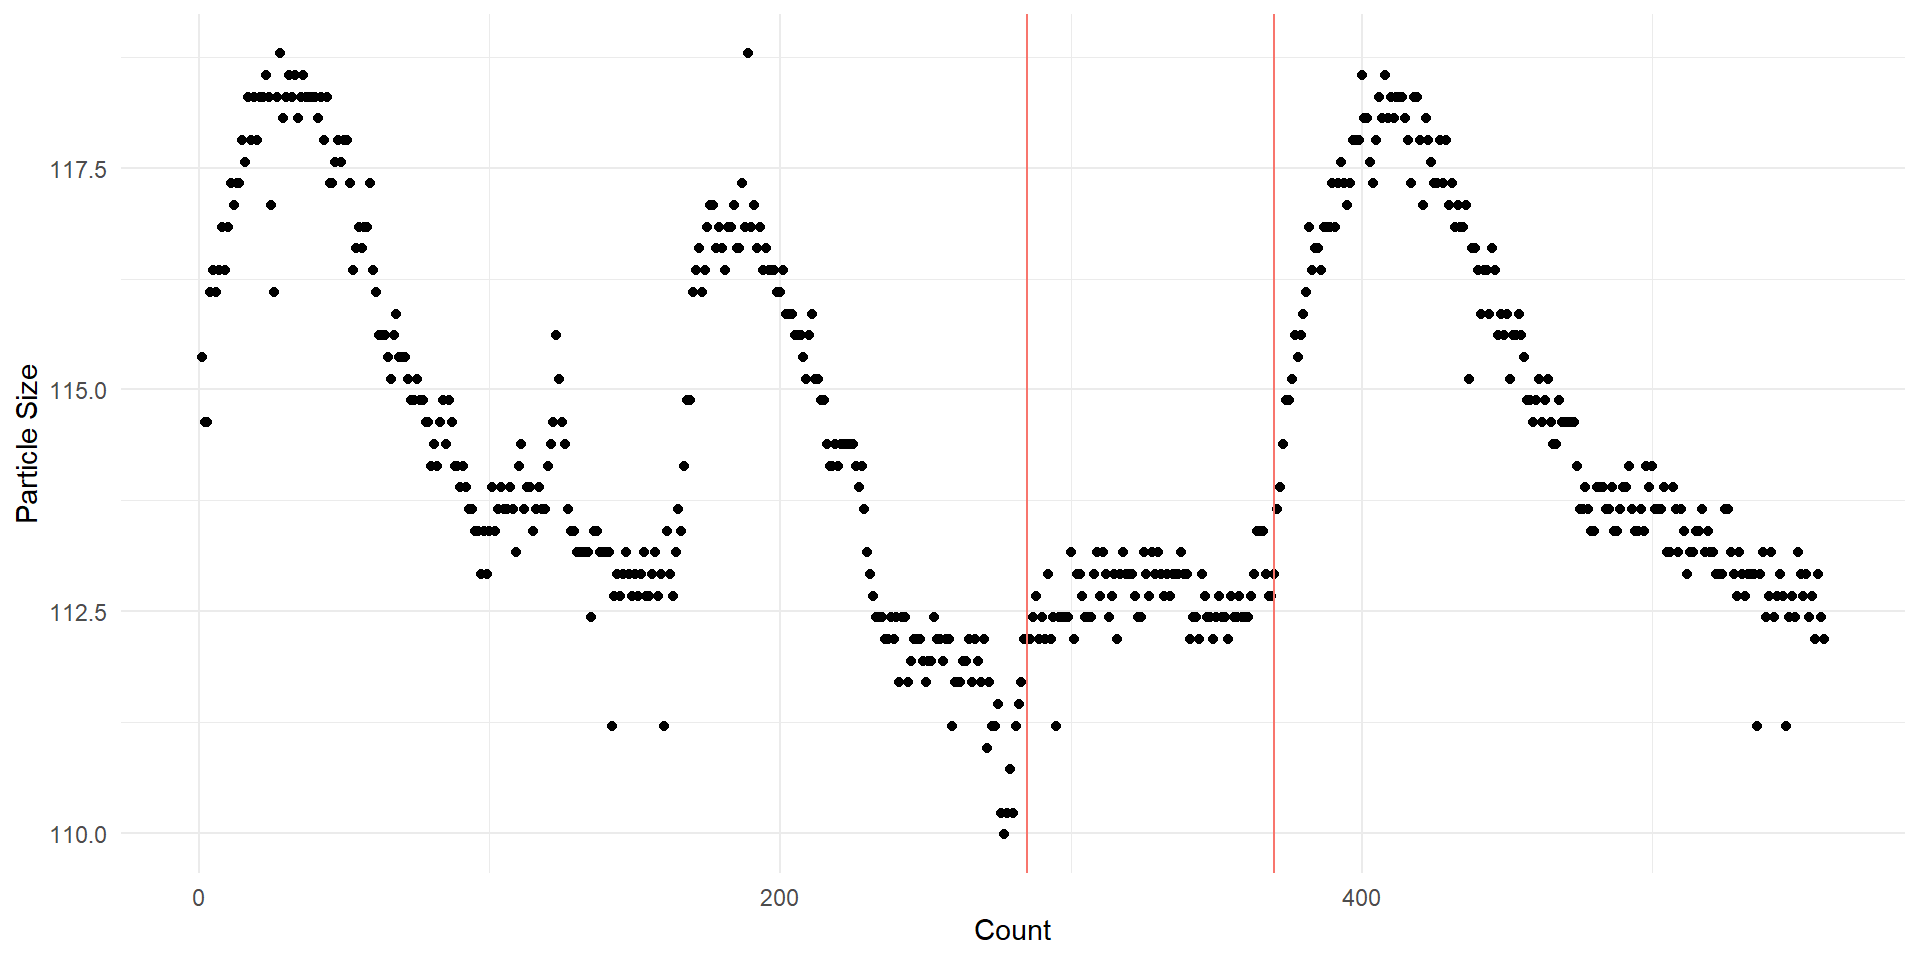
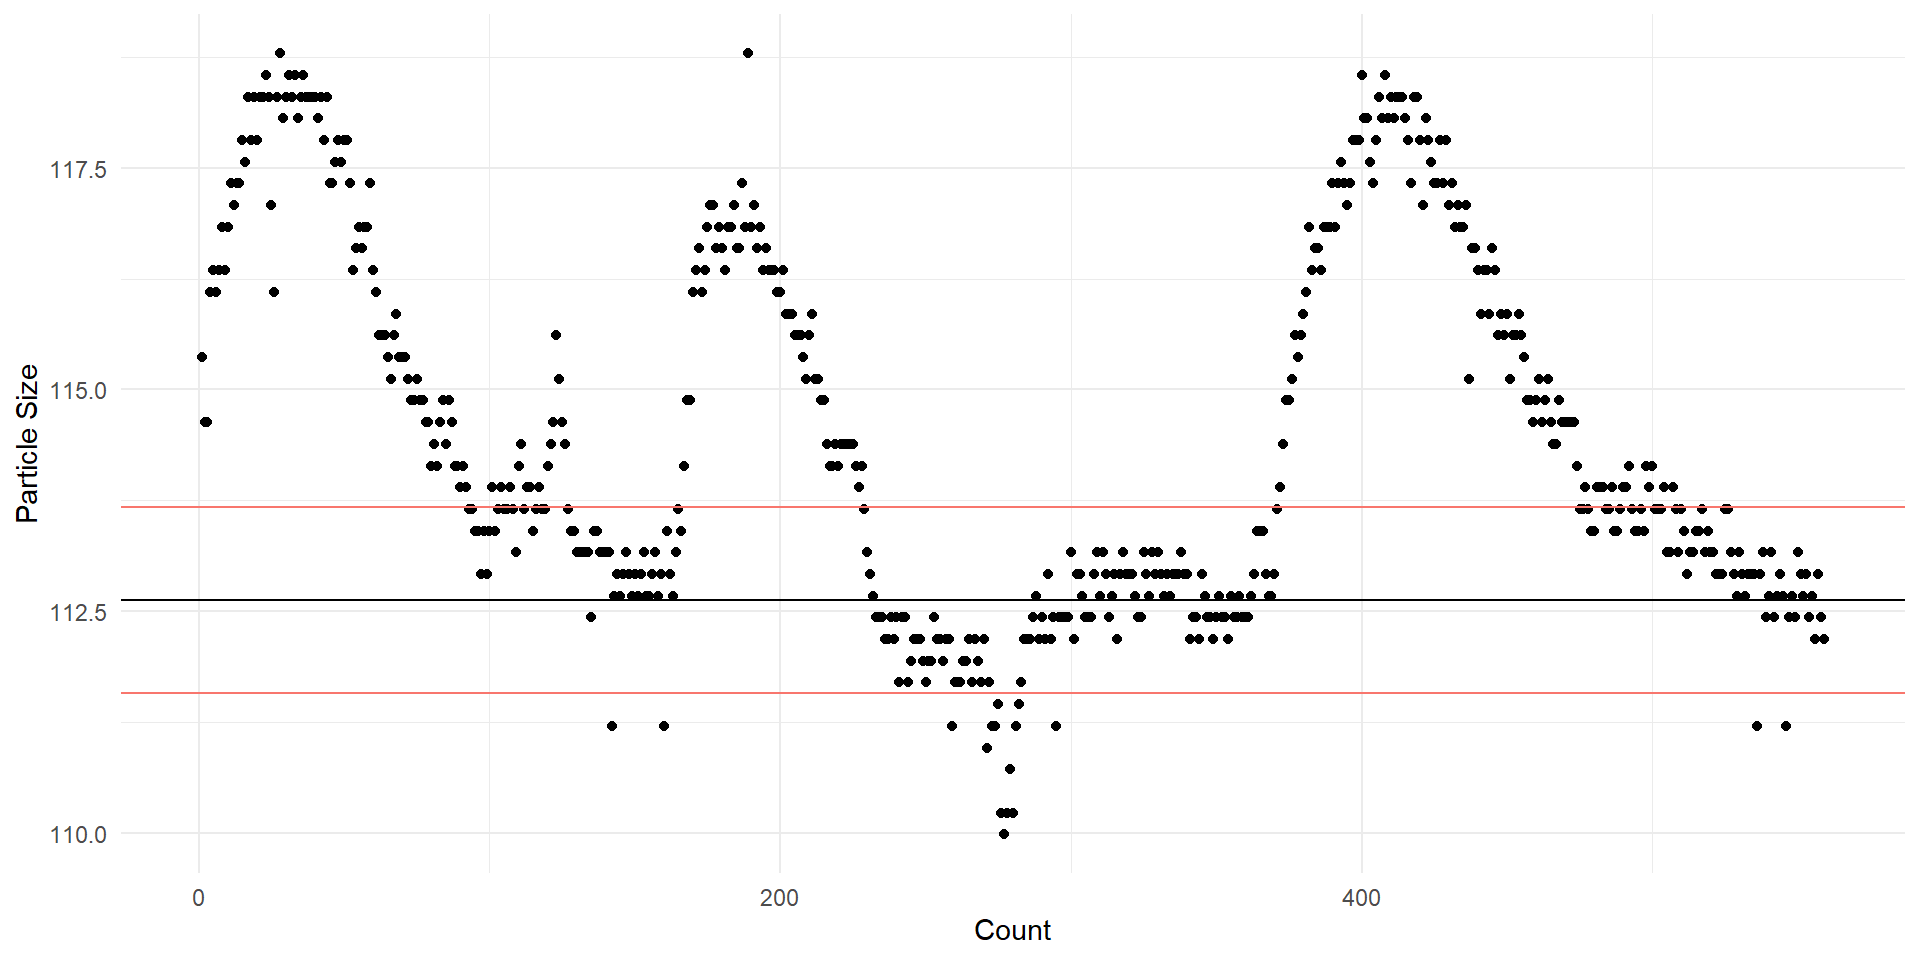
- This example shows the size of aerosol particles
- View the data before creating a control chart
- We can see that the variability isn’t random
![]()
Chart for aerosol particle size
Variable characteristics control chart data
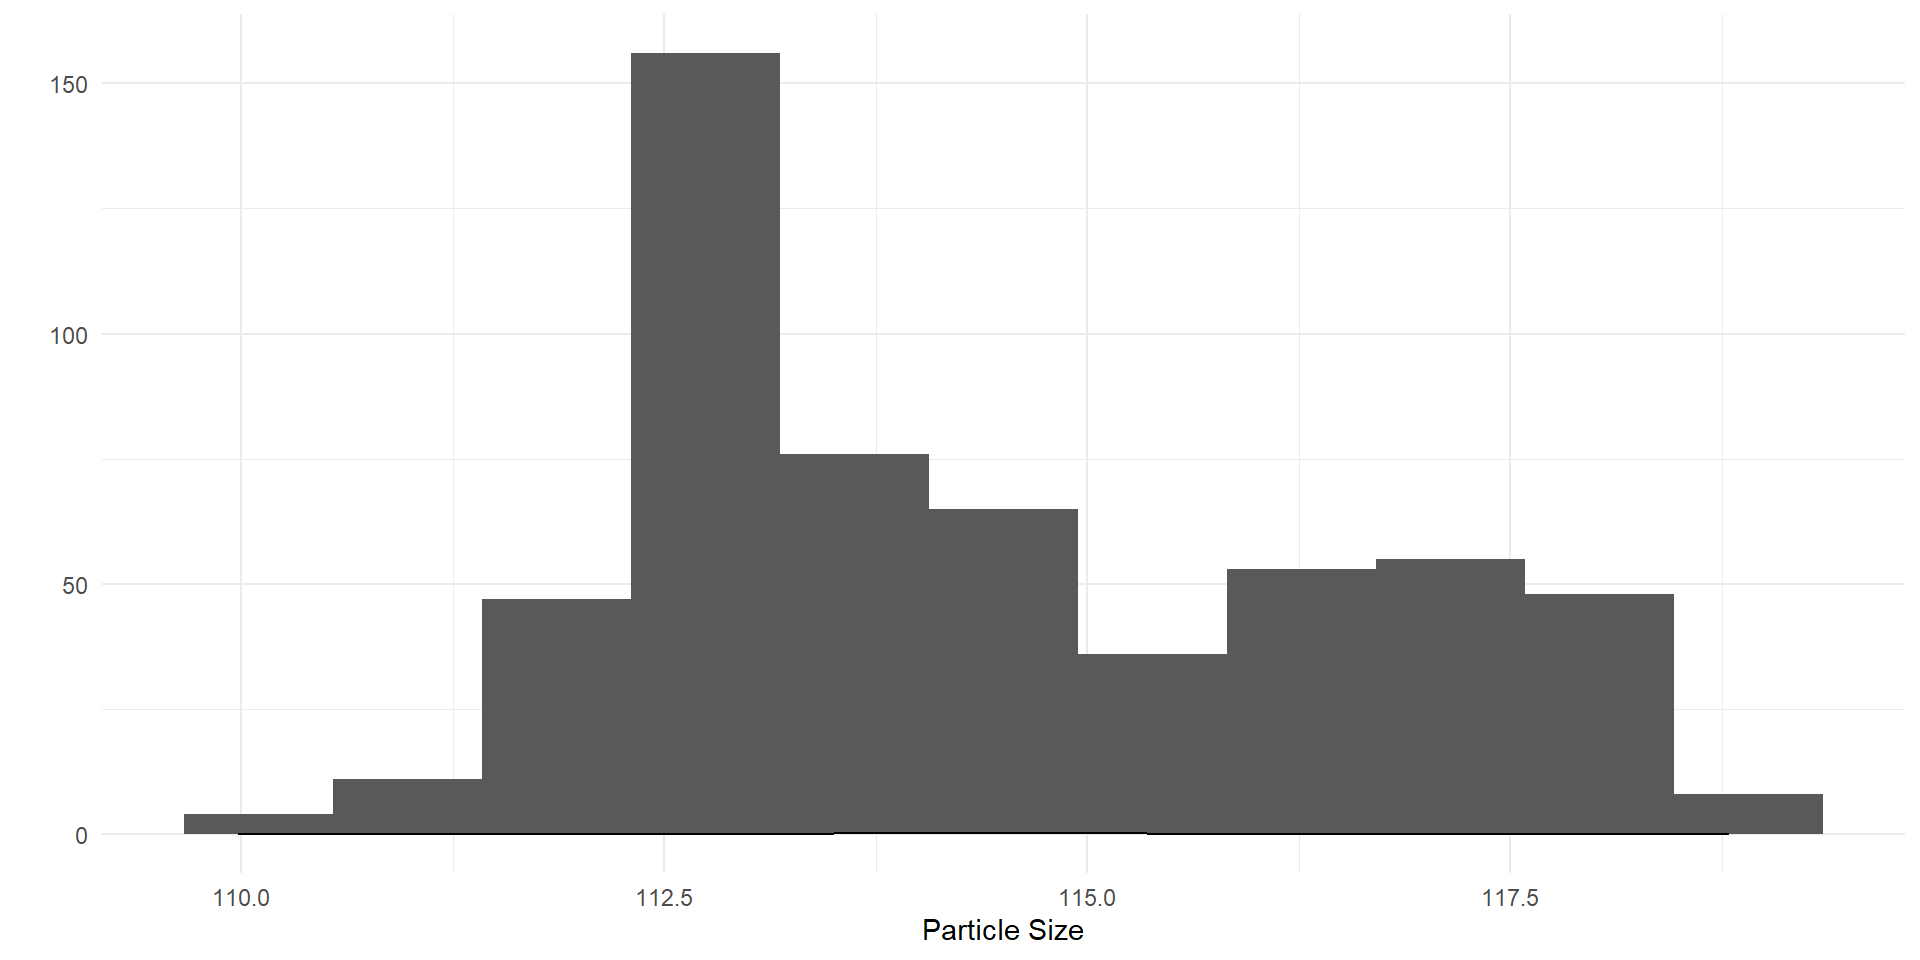
- We can view the data for the variable characteristics
- As a histogram and evaluate normality assumption like before
![]()
histogram of particle size
Variable characteristics (Shewhart) control chart
- With control levels based on the subset
- You can see that most of the samples are out-of-control
- Indicating special-cause variation
![]()
Shewhart control chart
- The middle line on the chart is
- the long-run or population mean
- x-bar for the process when it is in control
- The upper control line (UCL) and lower control line (LCL)
- Are 3 standard deviations (SD) above x-bar
- And 3SD below x-bar
Additional rules for out-of-control process
- These are the “Western Electric Company (WECO)” rules
- For identifying out-of-control samples
- In addition to being 3SD above the mean or
- 3SD below the mean
- 8 consecutive points above or below mean
- 4 out of 5 points 1SD above or 1SD below the mean
- 2 out of 3 points 2SD above or 2SD below the mean
- These added rules increase Type I errors by 3X over 3SD rule alone
Identifying source of the special cause variability
- Once special cause variability is found
- The source of the variability needs to be identified
- There are several tools for this part of SPC1
- Pareto chart
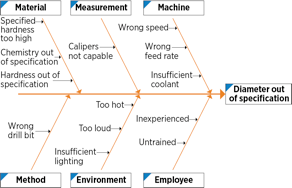
- Cause-and-effect (fishbone) diagram
- Flowchart
- And many others
Pareto Chart
![]()
Example Pareto chart on complaints
Cause-and-effect (fishbone) diagram
![]()
Fishbone diagram for part size error
Flowchart diagram
![]()
Flowchart diagram for customer comment