# A tibble: 2 × 6
  term         df sumsq meansq statistic   p.value
  <chr>     <dbl> <dbl>  <dbl>     <dbl>     <dbl>
1 class         3  237.  78.9       21.7  1.56e-13
2 Residuals 791 2870. 3.63 NA NA Post-Hoc Tests, Multiple Comparisons
IMS2 Ch. 22
Math 219
Yurk and Martin
Wordsum Score
- Do Wordsum test scores vary between self-identified social classes?
- Self-identified social classes: “Lower” (L), “Middle” (M), “Upper” (U), “Working” (W)
- Let \(\mu_C\) = mean score for social class \(C\)
- Hypothesis test
- \(H_0: \mu_L=\mu_M=\mu_U=\mu_W\)
- \(H_A:\) at least one of the means is different
ANOVA
- We conducted a hypothesis test based on a randomized null distribution of \(F\) statistics
- And a test (ANOVA) using a model (\(F\)-distribution)
- We found convincing evidence (\(F_{3,791}=21.73\), p-value < 0.001) that at least one mean score is different
Follow-Up Tests
- So far we have taken a holistic view, considering all of the groups at the same time to determine if at least one of the means is different
- If we conclude that there is convincing evidence that there is a difference, we can make pairwise group comparisons
- If there are \(k\) groups, then there are \(a=k\cdot(k-1)/2\) pairwise comparisons
- In the Wordsum example there are 4 groups, resulting in \(a = (4\cdot 3)/2=6\) possible pairwise comparisons
Multiple comparisons
We could perform 6 separate hypothesis tests (e.g., \(t\)-tests):
- \(H_0:\mu_L-\mu_M=0\), \(\hspace{2ex} H_A:\mu_L-\mu_M\neq0\)
- \(H_0:\mu_L-\mu_U=0\), \(\hspace{2ex} H_A:\mu_L-\mu_U\neq0\)
- \(H_0:\mu_L-\mu_W=0\), \(\hspace{2ex} H_A:\mu_L-\mu_W\neq0\)
- \(H_0:\mu_M-\mu_U=0\), \(\hspace{2ex} H_A:\mu_M-\mu_U\neq0\)
- \(H_0:\mu_M-\mu_W=0\), \(\hspace{2ex} H_A:\mu_M-\mu_W\neq0\)
- \(H_0:\mu_U-\mu_W=0\), \(\hspace{2ex} H_A:\mu_U-\mu_W\neq0\)
Data
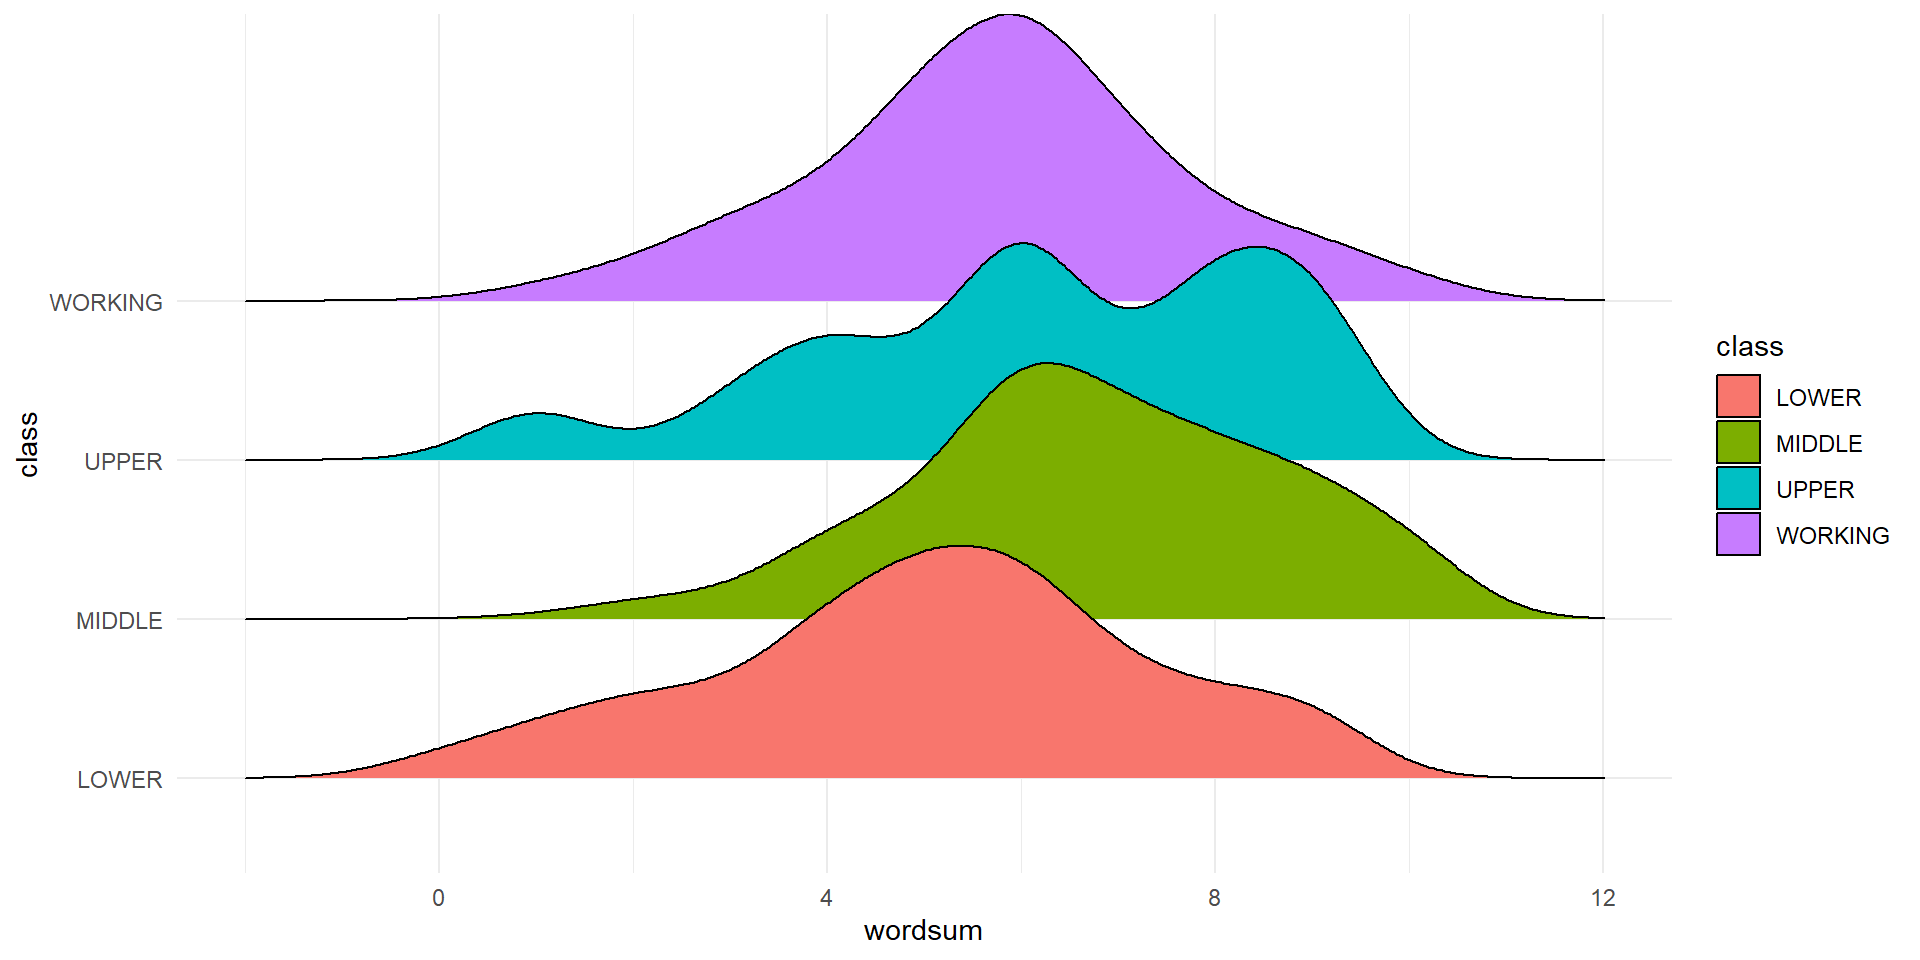
| class | n | mean | sd |
|---|---|---|---|
| LOWER | 41 | 5.07 | 2.24 |
| MIDDLE | 331 | 6.76 | 1.89 |
| UPPER | 16 | 6.19 | 2.34 |
| WORKING | 407 | 5.75 | 1.87 |
- Pairwise t-tests using pooled SD (pooled across all groups)
- No adjustment for multiple comparison
- p-values:
| LOWER | MIDDLE | UPPER | |
|---|---|---|---|
| MIDDLE | 1.1e-07 | - | - |
| UPPER | 0.048 | 0.240 | - |
| WORKING | 0.031 | 1.6e-12 | 0.367 |
The Problem with Multiple Comparisons
- With \(a\) pairwise comparisons using a significance level of \(\alpha\), for each test, the probability of making at least one Type 1 error if there are no difference between groups is \(1-(1-\alpha)^a\)
- If each \(H_0\) is true, probability of at least one Type 1 error in 6 tests with \(\alpha = 0.05\): \[1-0.95^6=0.265\]
Familywise Error Rate
- The Familywise Error rate (FWE) is the probability of making at least one Type 1 error when performing multiple hypothesis tests
- We can control the FWE using multiple comparison methods
- These methods use a reduced significance level for each hypothesis test to ensure \(FWE\leq\alpha\)
Bonferroni Method
- The Bonferroni method is the simplest multiple comparison method
- Let \(E_i\) be the event of making a Type 1 error with test \(i\)
- For \(a\) tests, \[P(E_1 \text{ or } E_2 \text{ or }\cdots\text{ or } E_a) \leq P(E_1) + P(E_2)+\ldots + P(E_a)\]
- If each test conducted at significance level \(\alpha/a\) \[FWE\leq\frac{\alpha}{a}+\frac{\alpha}{a}+\ldots+\frac{\alpha}{a}=a\cdot\frac{\alpha}{a}=\alpha\]
- For \(a\) tests, the Bonferroni method tests each one at a level of \(\alpha/a\)
- For the Wordscore example each test would use a level of \(0.05/6=0.00833\)
- Equivalently, the p-value from each test is adjusted by multiplying by the number of tests
- Then the adjusted p-values are compared to the original significance level
Adjusted P-Values
Using the Bonferroni method
library(magrittr) # to get the %$% pipe

gss %$%
  pairwise.t.test(wordsum, class, p.adjust.method = "bonferroni")
    Pairwise comparisons using t tests with pooled SD

data:  wordsum and class

        LOWER   MIDDLE  UPPER
MIDDLE  6.8e-07 -       -
UPPER   0.29    1.00    -
WORKING 0.18    9.8e-12 1.00

P value adjustment method: bonferroni - Bonferroni method is very conservative, resulting in FWE that is usually much smaller than \(\alpha\) (loss of power)
- There are alternative methods that are less conservative and have higher power while still controlling FWE
- E.g. Holm method (
p.adjust.method = "holm") - Note the p-value is smaller with Holm method for every pair except MIDDLE-WORKING
Tukey’s “Honestly Signficant Difference” Method
- Less conservative than Bonferroni for comparing means
  Tukey multiple comparisons of means
    95% family-wise confidence level

Fit: aov(formula = wordsum ~ class, data = gss)

$class
                     diff        lwr        upr     p adj
MIDDLE-LOWER    1.6881586  0.8762706  2.5000466 0.0000007
UPPER-LOWER     1.1143293 -0.3311641  2.5598226 0.1945998
WORKING-LOWER   0.6762150 -0.1272750  1.4797050 0.1335047
UPPER-MIDDLE   -0.5738293 -1.8290536  0.6813950 0.6416209
WORKING-MIDDLE -1.0119436 -1.3748942 -0.6489929 0.0000000
WORKING-UPPER -0.4381143 -1.6879230 0.8116945 0.8035197- Notice the p-values are between those from the Bonferroni and Holm methods
Multiple confidence intervals
- We can calculate confidence intervals for pairwise differences in means (or proportions) similarly
- Bonferroni correction can be applied to the confidence level
- Use \(100\cdot(1-\alpha/a)\%\) for \(a\) comparisons
- For a 95% confidence level, we would compute CI for the 6 pairwise differences with confidence level \(100\cdot(1-0.05/6)=99.17\%\)
- And the TukeyHSD function in R gives you CIs but only for multiple means
Conclusions
- We come to the same conclusions using the Tukey procedure or the Bonferroni method (but not the unadjusted p-values!)
- Based on the results of the ANOVA, we concluded that there is convincing evidence that at least one of the mean scores is different
- We followed this with post-hoc pairwise tests for differences between group means
- Based on the pairwise tests, we conclude that there is convincing evidence of differences between mean scores for the “Middle” and “Lower” social classes and and between mean scores for the “Working” and “Middle” social classes.
- We are unable to reject the other null hypotheses
- For example, it is plausible that the mean scores are the same for “Upper” and “Lower” social classes
Post-hoc tests for multiple proportions
- We can also perform post-hoc tests after we perform a hypothesis test for multiple proportions (e.g., a chi-squared test) and find CI’s using the Bonferroni method
- In this case we would use the
pairwise.prop.testfunction in R but only with a binary response - In the gss2016 data set we can convert the response to binary by
- Combining “ABOUT RIGHT” and “TOO MUCH” into a single level we’ll call “ENOUGH”
| Party | TOO LITTLE | ENOUGH | Total |
|---|---|---|---|
| Dem | 17 | 26 | 43 |
| Ind | 20 | 52 | 72 |
| Rep | 24 | 10 | 34 |
| Total | 61 | 88 | 149 |
Multiple proportions comparisons
We could perform 3 separate hypothesis tests (e.g., \(Z\)-tests):
- \(H_0:p_D-p_I=0\), \(\hspace{2ex} H_A:p_D-p_I\neq0\)
- \(H_0:p_D-p_R=0\), \(\hspace{2ex} H_A:p_D-p_R\neq0\)
- \(H_0:p_I-p_R=0\), \(\hspace{2ex} H_A:p_I-p_R\neq0\)
Chi-squared analysis and p-value
Find the p-value for proportion pairs
    Pairwise comparisons using Pairwise comparison of proportions

data:  gss_mat

    Dem     Ind
Ind 0.27151 -
Rep 0.02613 0.00022

P value adjustment method: holm - Based on the pairwise tests, we conclude that there is convincing evidence for Rep vs. Ind and Rep vs. Dem
- We are unable to reject the third null hypothesis for Ind vs. Dem.