Compare Two Independent Means
IMS2 Ch. 20
Math 219
Yurk
Birth Weights and Smoking
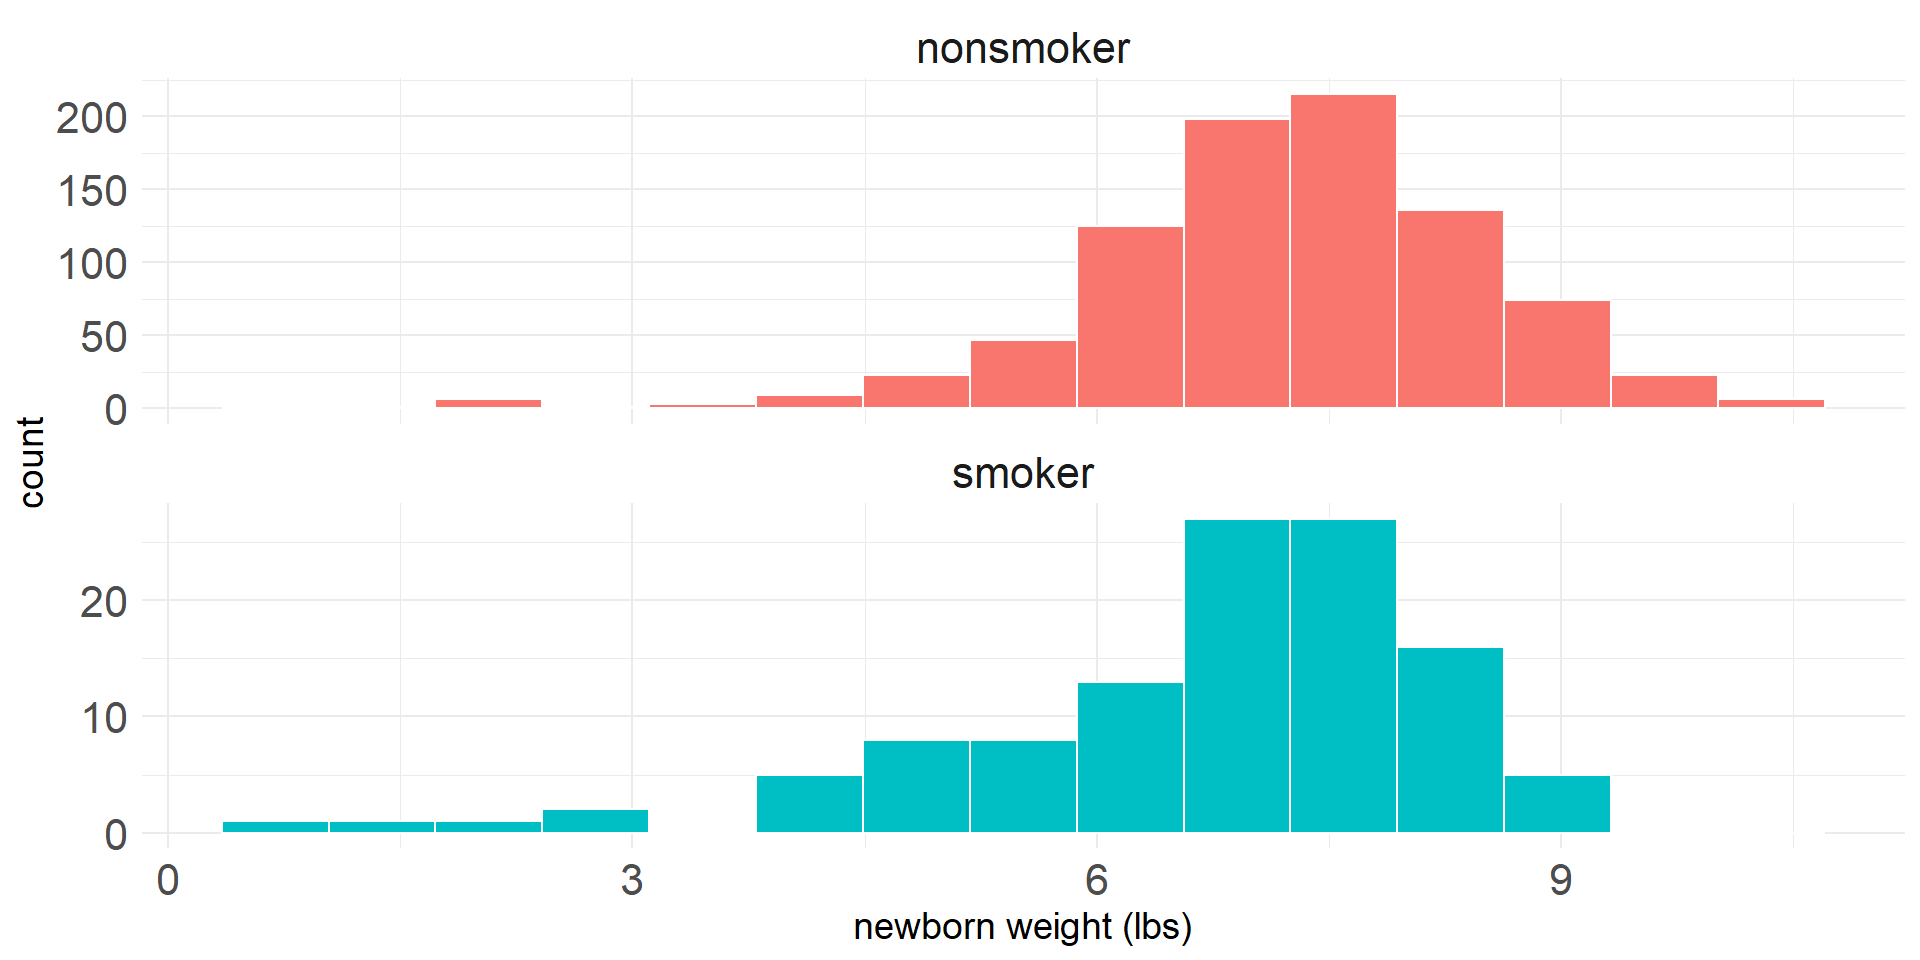
- Do infants whose mothers smoke have a different mean birth weight than infants whose mothers do not smoke?
- Let \(\mu_n\) be the mean weight (lbs) of infants whose mothers did not smoke, and let \(\mu_s\) be the mean for infants whose mothers smoked
Inference
- We will estimate the difference in mean birth weights \(\mu_n-\mu_s\) using a confidence interval
- We will conduct a hypothesis test with hypotheses
- \(H_0: \mu_n-\mu_s = 0\)
- \(H_A: \mu_n-\mu_s \neq 0\)
Data
births141 dataset- Random sample of 1,000 cases from US birth data set from 2014 (19 removed with missing values)
habitis smoking habit (“smoker” or nonsmoker”)weightis birth weight in pounds
EDA
| habit | n | mean | sd |
|---|---|---|---|
| nonsmoker | 867 | 7.27 | 1.23 |
| smoker | 114 | 6.68 | 1.60 |
The observed difference in means is \[\begin{array}{lcr}\bar{x}_n-\bar{x}_s &=& 7.27-6.68\\ &=& 0.59\end{array}\]
Randomization Test for Difference in Means
- We can simulate a true null hypothesis by randomly permuting the values of the response variable
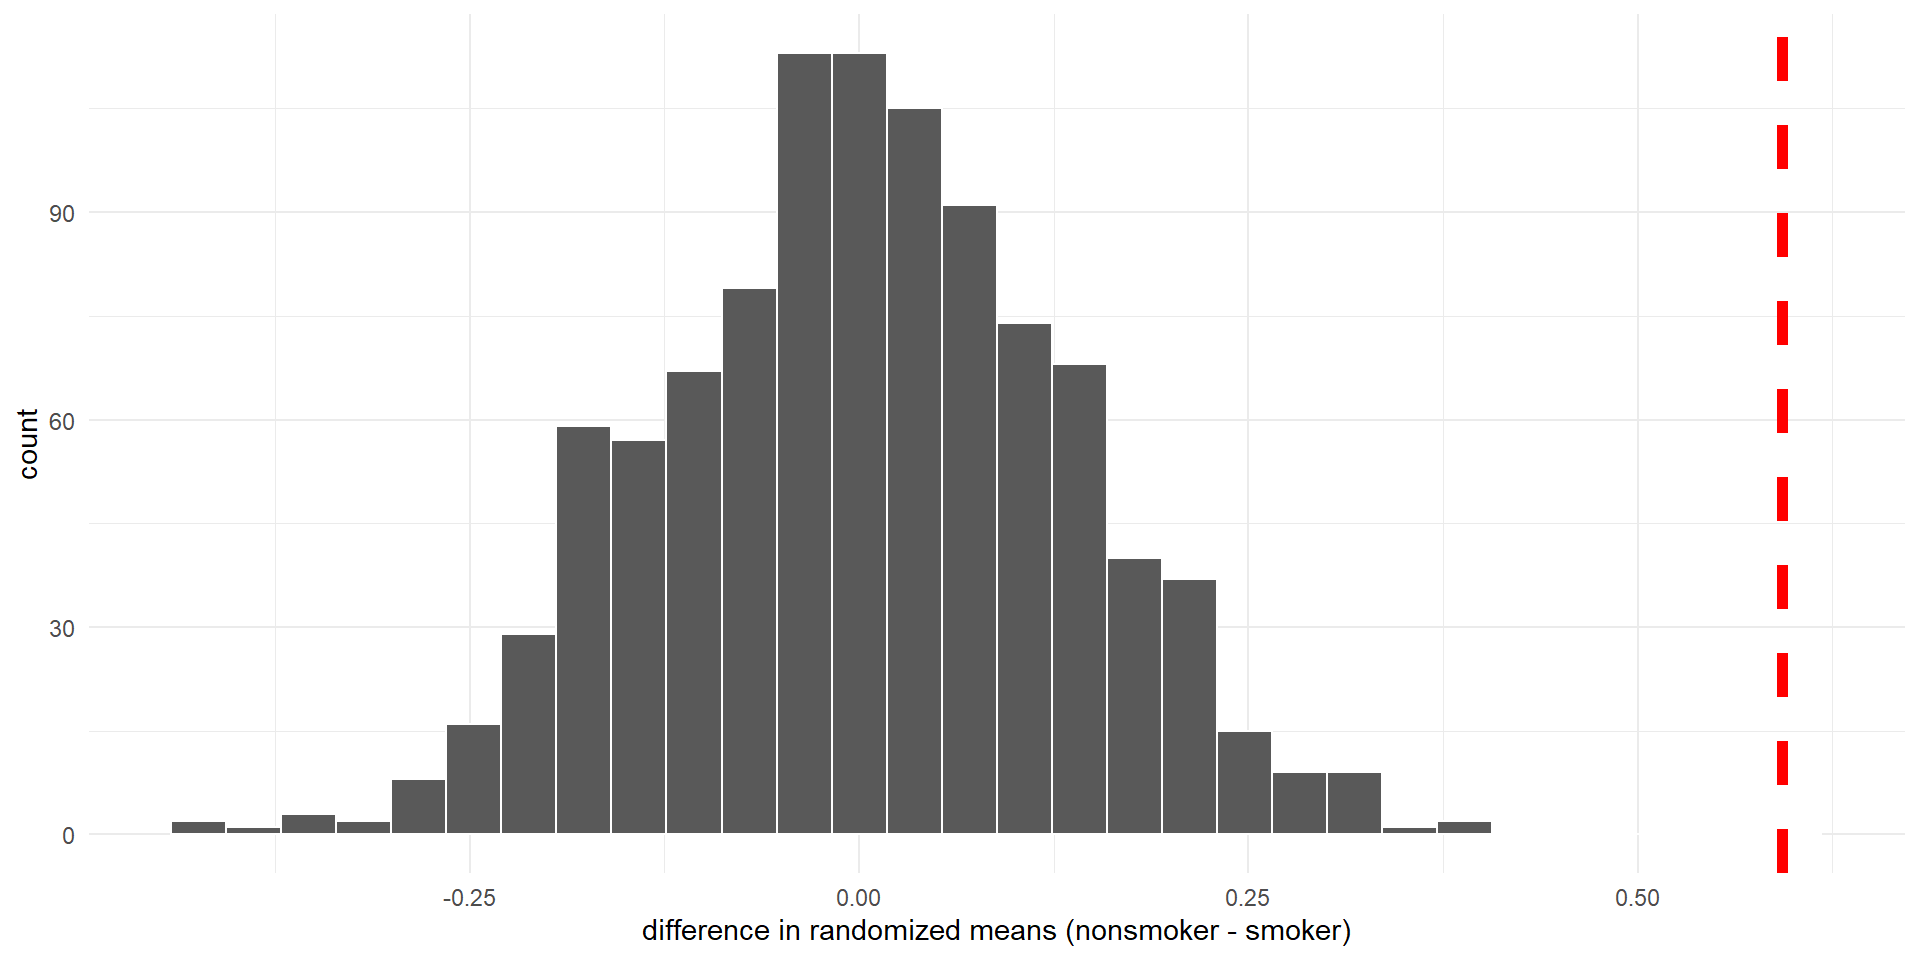
Histogram of differences in means (null distribution) calculated from 1,000 random permutations of birth weights. Observed difference is indicated by dashed vertical line.
- The p-value is the proportion of randomized differences that are at least as extreme as the observed value (\(\leq\) -0.59 or \(\geq\) 0.59)
- There are no such randomized differences, so the p-value is approximately 0
Test Statistic for Comparing Two Means
- The test statistic for comparing two means is the \(T\) statistic (\(T\) score)
- We will use a version of the \(T\) statistic that assumes the two populations have equal variance (different than the version presented in the text)
Pooled Sample Standard Deviation
- First we compute the pooled sample standard deviation, \[s_p = \sqrt{\frac{(n_1-1)s_1^2+(n_2-1)s_2^2}{n_1+n_2-2}}\]
- The pooled sample standard deviation in birth weights is \[\begin{array}{rcl} s_p &=& \sqrt{\frac{(867-1)\cdot 1.23^2+(114-1)\cdot 1.60^2}{867+114-2}}\\ &=& 1.28\end{array}\]
- The \(T\) statistic is \[T=\frac{(\bar{x}_1-\bar{x}_2)-0}{s_p\sqrt{\frac{1}{n_1}+\frac{1}{n_2}}}\]
- For the birth weight example, the value is \[T=\frac{0.59-0}{1.28\cdot\sqrt{\frac{1}{867}+\frac{1}{114}}} = 4.63\]
Mathematical Model for Testing the Difference in Means
Note
When the null hypothesis is true and the following technical conditions are met, the \(T\) score has a \(t\)-distribution with \(df=n_1+n_2-2\) degrees of freedom.
- Groups have equal variance in the population
- Independent observations within and between groups
- Normality: Large samples and no extreme outliers.
We can use this rule of thumb for the normality check:
- If \(n<30\) and their are no clear outliers, then we usually assume the data come from a nearly normal distribution to satisfy the condition.
- If \(n\geq30\) and there are no particularly extreme outliers, then we usually assume the sampling distribution of \(\bar{x}\) is nearly normal, even if the underlying population distribution is not
Two Sample T-Test
- The degrees of freedom for the birth weight example is \(df=867+114-2=979\).
- The p-value is extremely small
Note About Relaxing the Equal Variance Assumption
- We can compute a \(T\) statistic without assuming equal variances (see the formula in the book)
- If the null hypothesis is true and the technical conditions are met, then the distribution of these \(T\) statistics will be be approximately \(t\)-distributed
- The \(df\) for the approximating \(t\) distribution involves a complicated calculation (not the one listed in the text)
- We can use the
t_testfunction in theinferpackage to calculate a p-value - It calculates the \(T\) statistic, \(df\), and the p-value for us
- It does NOT check conditions
- If we specify the option
var.equal = TRUE, these calculations will use the equal variance assumption
- The value of \(T\) and the p-value differ from ours due to rounding
- Specifying
var.equal = FALSErelaxes the equal variance assumption - Note that \(df\) is no longer an integer
Bootstrap Confidence Interval for Difference in Means
- The method for calculating bootsrap confidence intervals for a difference in means is similar to the methods we used for a difference in proportions
- We create bootstrap samples from each group (resampling with replacement) and calculate a difference in means
- We do this 1,000 time and use the resulting sampling distribution to calculate a bootstrap percentile CI or a boostrap SE CI
- Lets calculate differences in bootstrapped means for the birth weight example
- The 95% boostrap percentile CI is (0.312, 0.917)
births_boot <- births14 |>
  specify(weight ~ habit) |>
  generate(reps = 1000, type = "bootstrap") |>
  calculate(stat = "diff in means", order = c("nonsmoker", "smoker"))

births_boot |>
  summarize(ci_lo = quantile(stat, 0.025),
            ci_hi = quantile(stat, 0.975))
# A tibble: 1 × 2
ci_lo ci_hi
<dbl> <dbl>
1 0.312 0.917Estimating the Difference in Means Using a Mathematical Model
- If the technical conditions are met, including the equal variance assumption, then we can use the \(t\)-distribution to estimate the difference in means
- We can calculate a confidence interval for the difference in means as \[(\bar{x}_1-\bar{x}_2)\pm t^{\ast}_{df}\times SE\]
- Assuming equal variance, \(df=n_1+n_2-2\), and the standard error is \[SE = s_p\sqrt{\frac{1}{n_1}+\frac{1}{n_2}}\]
- The value of \(t^{\ast}_{df}\) depends on the degrees of freedom and the confidence level
- For the birth weights example \[SE=1.28\cdot\sqrt{\frac{1}{867}+\frac{1}{114}}=0.128\]
- Since \(df=979\) for this example, the value of \(t^{\ast}_{df}\) for a 95% confidence interval is 1.96
- Thus, the 95% confidence interval is \[0.59\pm1.96\times0.128=0.59\pm0.251\]
- In interval form it is approximately (0.339, 0.841)
Relaxing the Equal Variance Assumption for CI
- We can also use the
t_testfunction to calculate CI - Here is the version with the equal variance assumption
- Here is the confidence interval calculated without assuming equal variances
Conclusions
- We get the same result from both versions of the hypothesis test.
- We reject the null hypothesis at the \(\alpha=0.05\) significance level and conclude that there is strong evidence of a difference in the average weights of infants born to mothers who smoked and those who did not (p < 0.001)
- We are 95% confident that the mean weight of babies born to mothers who did not smoke is between 0.285 and 0.900 pounds higher than the mean weight of babies whose mothers smoked
- This result is also consistent with the result of the hypothesis test, since 0 does not appear in the 95% confidence interval