Two-sided Tests and Decision Errors
IMS2 Ch. 14
Math 219
Yurk and Martin
CPR Study
- Research question: Do blood thinners affect survival rate in heart attack patients that have received CPR?
cpr1 dataset- 2 variables
- group: treatment (received blood thinner) or control (did not)
- outcome: died or survived (for at least 24 hours)
- 90 patients (40 treatment, 50 control, randomly assigned)
Hypotheses
- Blood thinners can be administered to treat a clot that is causing a heart attack
- CPR can cause internal injuries
- Blood thinners can make it more difficult for these injuries to heal
- Do blood thinners affect survival in a positive or negative way?
- Alternative hypothesis reflects the fact that we don’t have expectations about the direction of the relationship
Two-sided hypothesis test
\(H_0\): Blood thinners do not affect survival rate. \(p_T-p_C = 0\)
\(H_A\): Blood thinners affect survival rate. \(p_T-p_C \neq 0\)
Example of one-sided hypothesis test
\(H_0\): Blood thinners do not affect survival rate. \(p_T-p_C = 0\)
\(H_A\): Blood thinners increase survival rate. \(p_T-p_C > 0\)
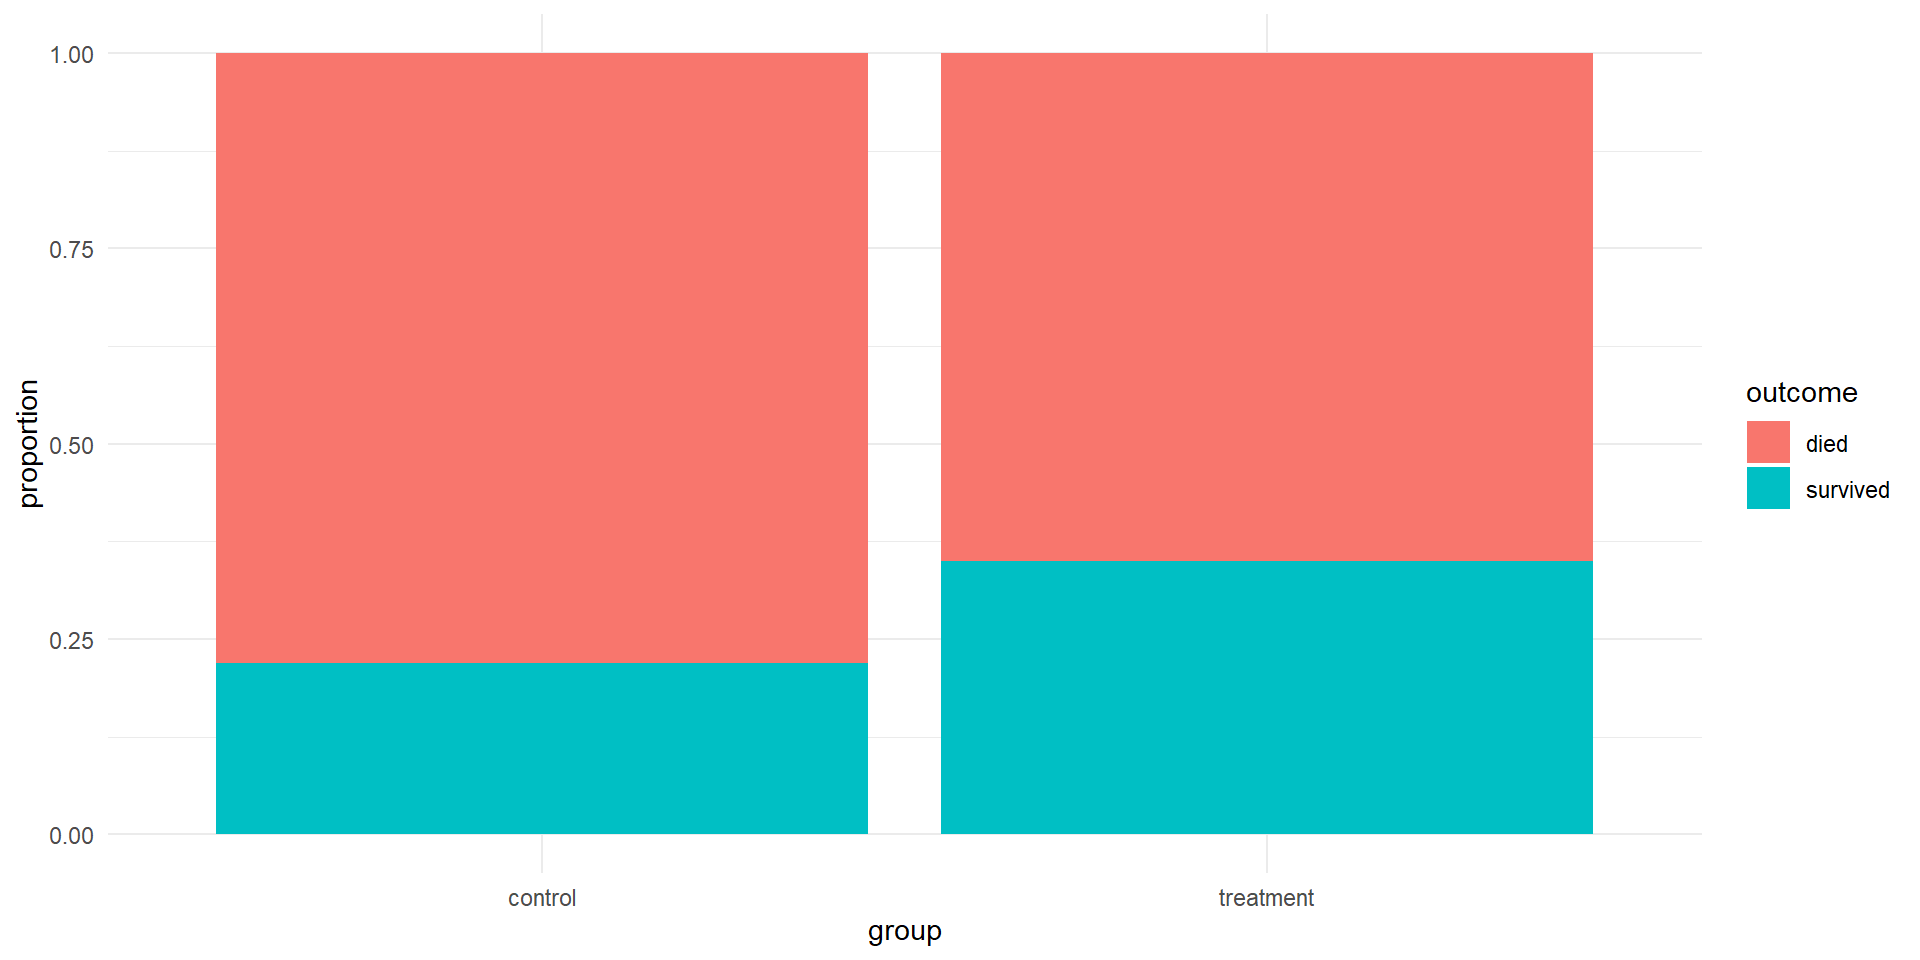
Results (EDA)
Difference in proportions
- Success: outcome = “survived”
- Statistic of interest: difference in proportions \[\hat{p}_T-\hat{p}_C\]
- Observed difference: \[\frac{14}{40}-\frac{11}{50}=0.13\]
Hypothesis test
- Technical conditions met for using a normal approximation
- SE = 0.0955 (more on estimating this in Ch. 17)
- Null distribution: \(N(0, 0.0955)\)
- We will use significance level \(\alpha=0.05\)
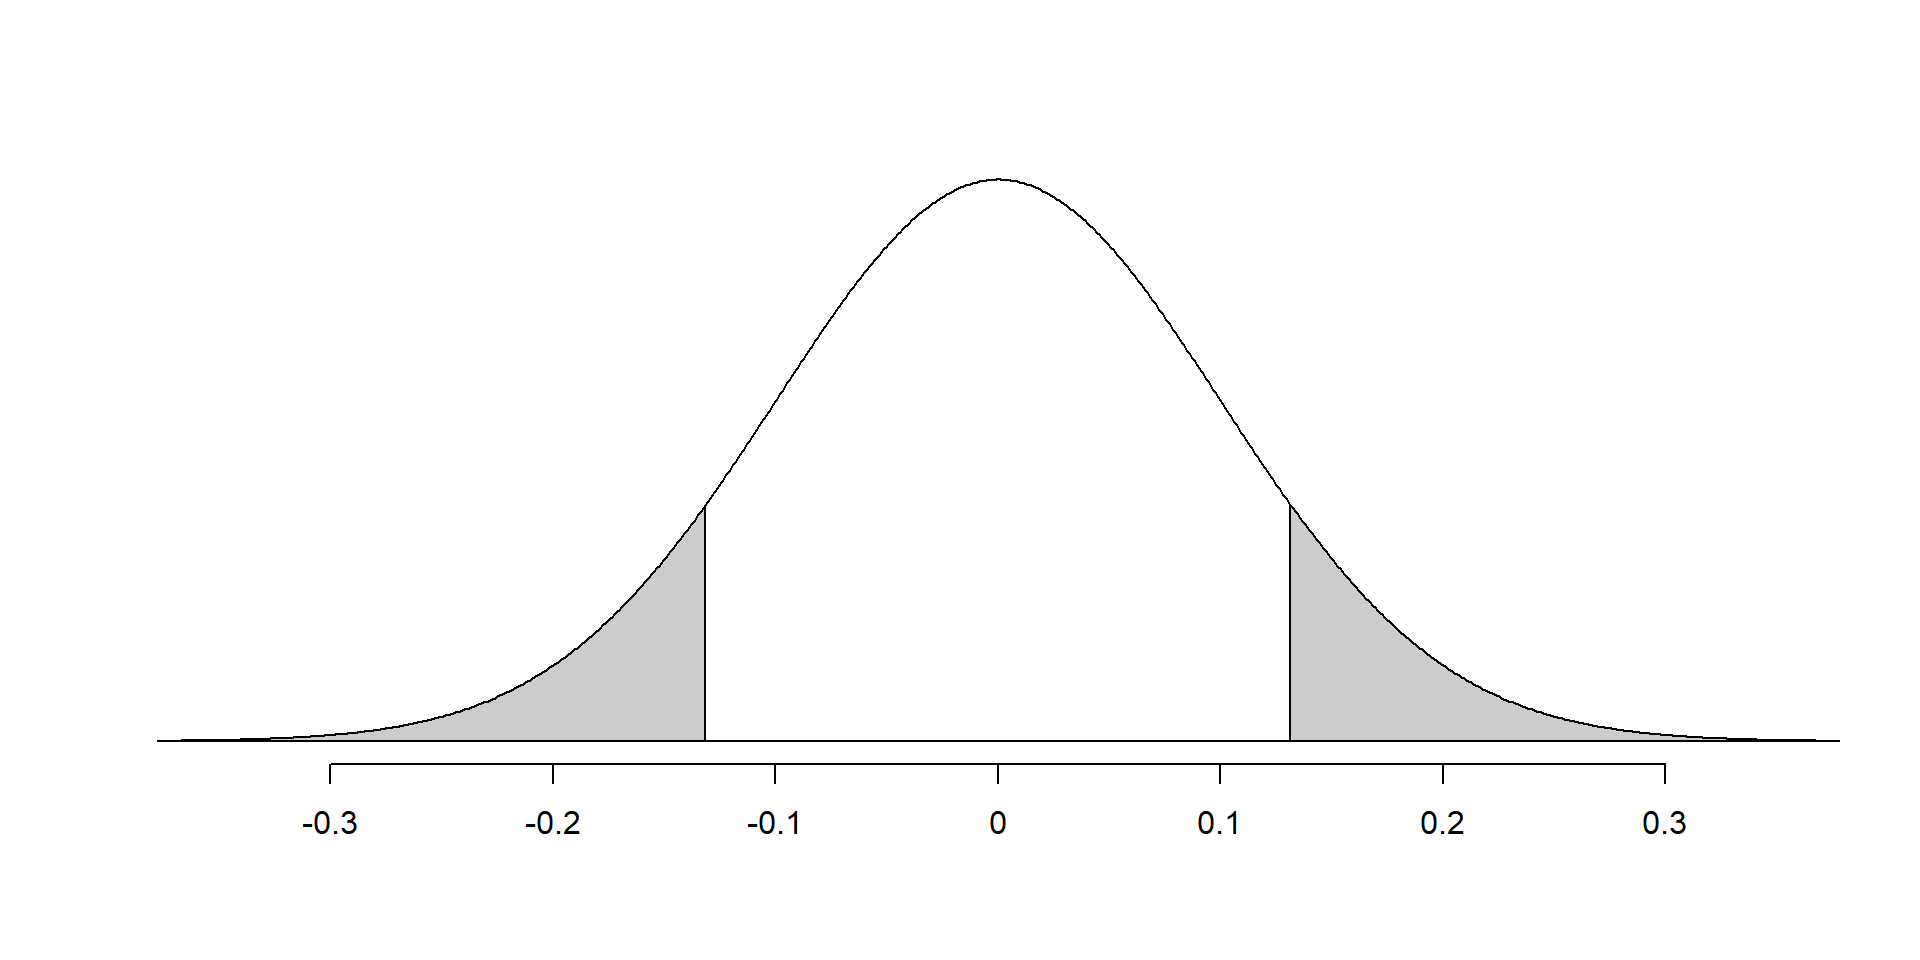
Density function for N(0, 0.0955) with tails shaded beyond 0.13.
- p-value is probability that statistic is at least as extreme as observed value (0.13)
- 2-sided test: at least as extreme means \(\geq 0.13\) or \(\leq -0.13\)
- Since the null distribution is symmetric, the p-value will be twice as large for a 2-sided test
- Since the p-value is greater than 0.05, we do not reject the null hypothesis
- It is plausible that there is no difference in survival rates between the two groups
Decision Errors: Four Scenarios
When we make a decision about \(H_0\), there are four possible outcomes:
| \(H_0\) True | \(H_0\) False | |
|---|---|---|
| Reject \(H_0\) | Type 1 Error | Correct |
| Don’t Reject \(H_0\) | Correct | Type 2 Error |
Two ways to be right, two ways to be wrong.
Controlling Type 1 Errors
- Type 1 Error is typically considered more severe
- The probability of making a type 1 error (assuming the null is true) is equal to the significance level
- Can reduce \(\alpha\) to make type 1 errors less likely
Controlling Type 2 Errors
- There is a trade-off between the two types of errors
- Decreasing probability of type 1, increases the probability of type 2
- Statistical Power is the probability of rejecting the null hypothesis if the alternative is true
- Higher statistical power reduces the chance of making a type 2 error
- Statistical power is related to effect size (easier to detect larger effects), sample size (larger sample results in more power), among other things
- The effect is proportional to the difference between the null value, \(p_0\), and the observed statistic, \(\hat{p}\)
Statistical Modeling
- If the difference in survival rate had been
- Significantly associated with giving blood thinners
- We could have used giving blood thinners to
- Predict an increased chance of survival with blood thinners
- This is a statistical model
- The linear models we studied earlier are statistical models
Key Assumptions: Model vs. Reality
- Statistical models are not reality.
- They make key assumptions to which we need to pay careful attention
- Otherwise we may leap too quickly to an incorrect conclusion
- For example, with the blood thinner and heart attack survival example
- The survival rate stays the same over time, but what if there is a different blood thinner
- Can we reasonably assume all blood thinners have the same effect?
- Maybe but our models rely on such simplifying assumptions
- Thus, when we said “We cannot reject the null hypothesis”
- It assumes the survival rate doesn’t change for different blood thinners
- “All models are wrong, but some are useful.” George E.P. Box
Model Prediction
“Sometime in the next 15 years, the end will come, and by ‘the end’ I mean an utter breakdown of the capacity of the planet to support humanity.”
“Most of the people who are going to die in the greatest cataclysm in the history of man have already been born.”
Model Prediction Gone Wrong
“Sometime in the next 15 years, the end will come, and by ‘the end’ I mean an utter breakdown of the capacity of the planet to support humanity.”
“Most of the people who are going to die in the greatest cataclysm in the history of man have already been born.”
– Paul R. Ehrlich, 1969, author of “The Population Bomb”

References
- Introduction to Modern Statistics (2e) textbook by Mine Çetinkaya-Rundel and Johanna Hardin
- Chapter 14
Population Bomb Information: