A sampling distribution is the distribution we would obtain if we could select samples of the same sample size again and again from the same population, calculating the value of the statistic of interest each time
Much of inferential statistics is based on being able to approximate sampling distributions
We rarely have the ability to select many samples from the same population (if we did we would usually just select a larger sample!)
However, we can make up a population and repeatedly sample from it to test different statistical ideas
Candidate X
60% of US voters support Candidate X for president (parameter: p = 0.6)
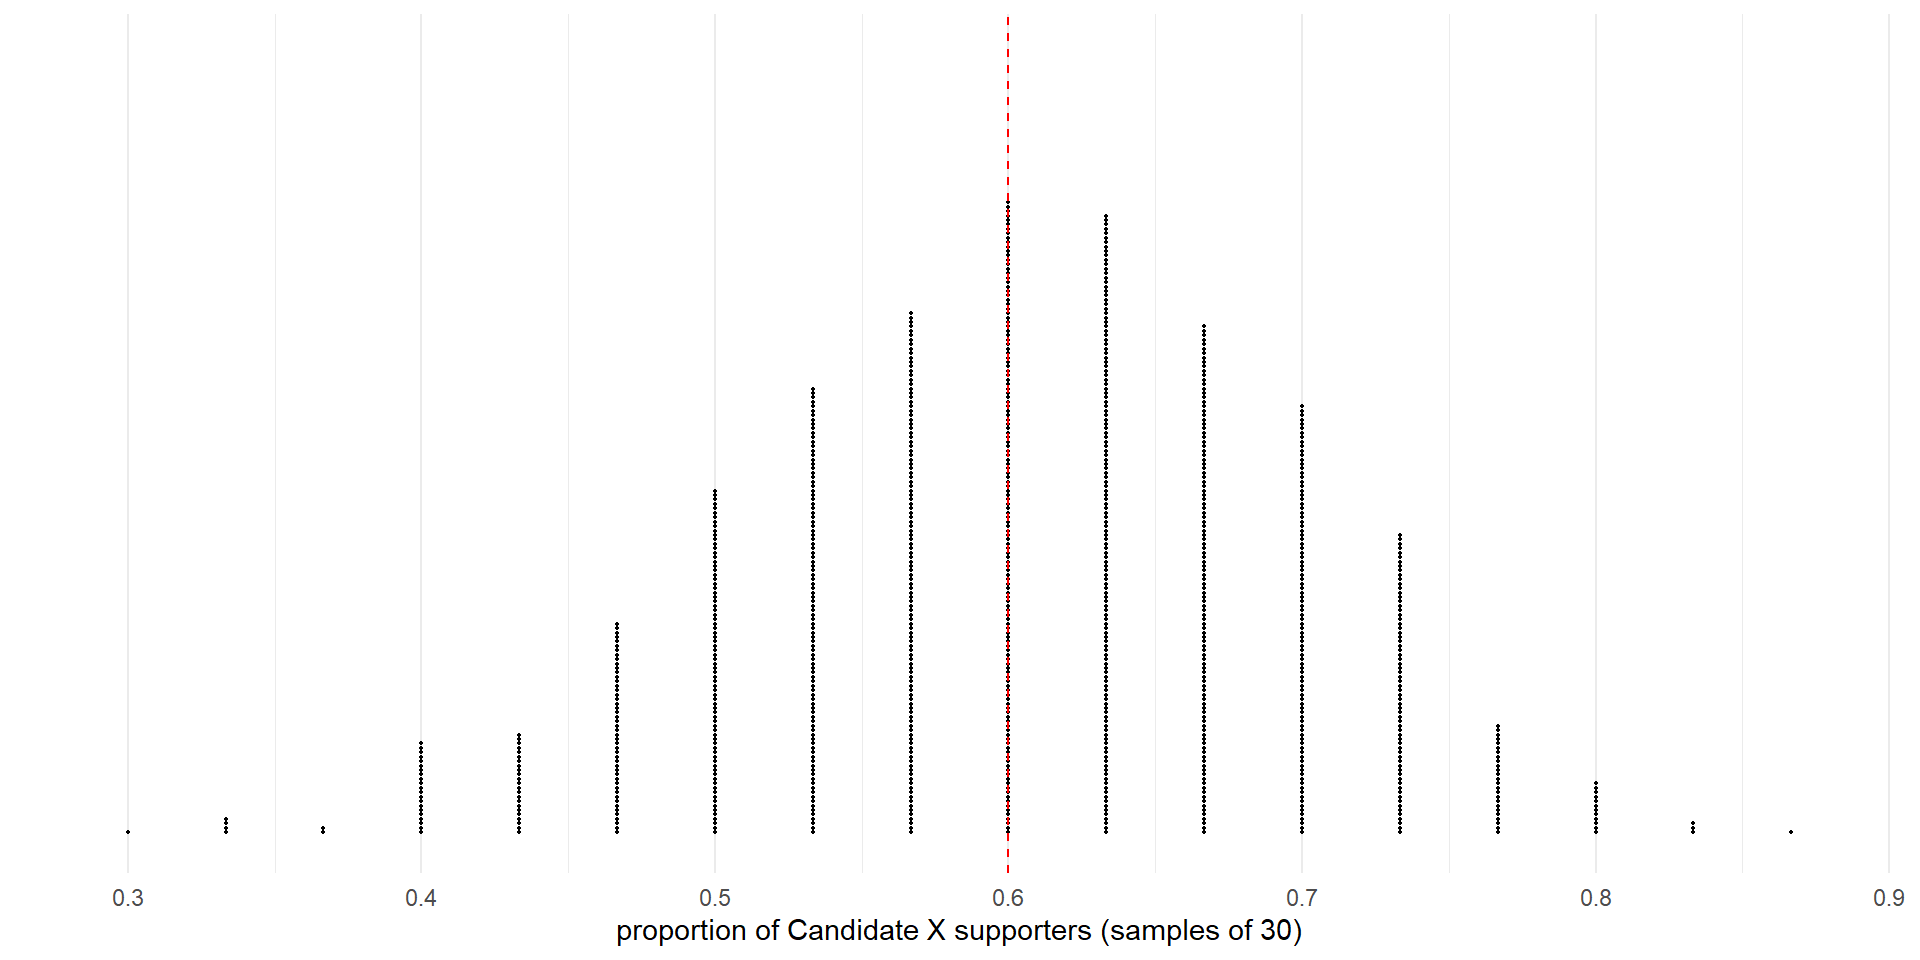
We repeatedly selected random samples of 30 voters from the theoretical population (1,000 times) and calculated the proportion of supporters for each sample (statistic: \(\hat{p}\))
What does the sampling distribution look like?
Sampling distribution. Proportions for 1,000 samples of 30 from a population with 60% (dashed vertical line) support for Candidate X.
Standard Error
The standard error is the standard deviation of the statistic
We can calculate the standard error for the proportion of yes votes for Candidate X.
all_props |>summarize(se =sd(prop_yes))
A single sample
Suppose you work for Candidate X’s campaign and want to estimate the proportion of US voters that support Candidate X
You conduct a poll in which you select a sample of 30 voters
Results of the poll
one_poll
You find that 21 of them (70%) support Candidate X
This gives you a point estimate for the proportion of voters who support Candidate X (0.7)
However, we know that there will be variability from sample to sample, creating uncertainty in our estimate
We can express that uncertainty by making an interval estimate instead
E.g., we might estimate Candidate X’s support to be between 0.6 and 0.8 based on how much the statistic is expected to vary
Calculating a 95% confidence interval is one way to find such an estimate
To calculate one from a single sample, we need to approximate the sampling distribution
We can use a randomization-based approach called bootstrapping
Bootstrapping
In practice, our single sample is the best approximation we have of the population
We can simulate repeated random sampling from the population by randomly sampling from the sample with replacement
We select bootstrap samples that are the same size as the original sample
Variability tends to be very close to the variability in the sampling distribution
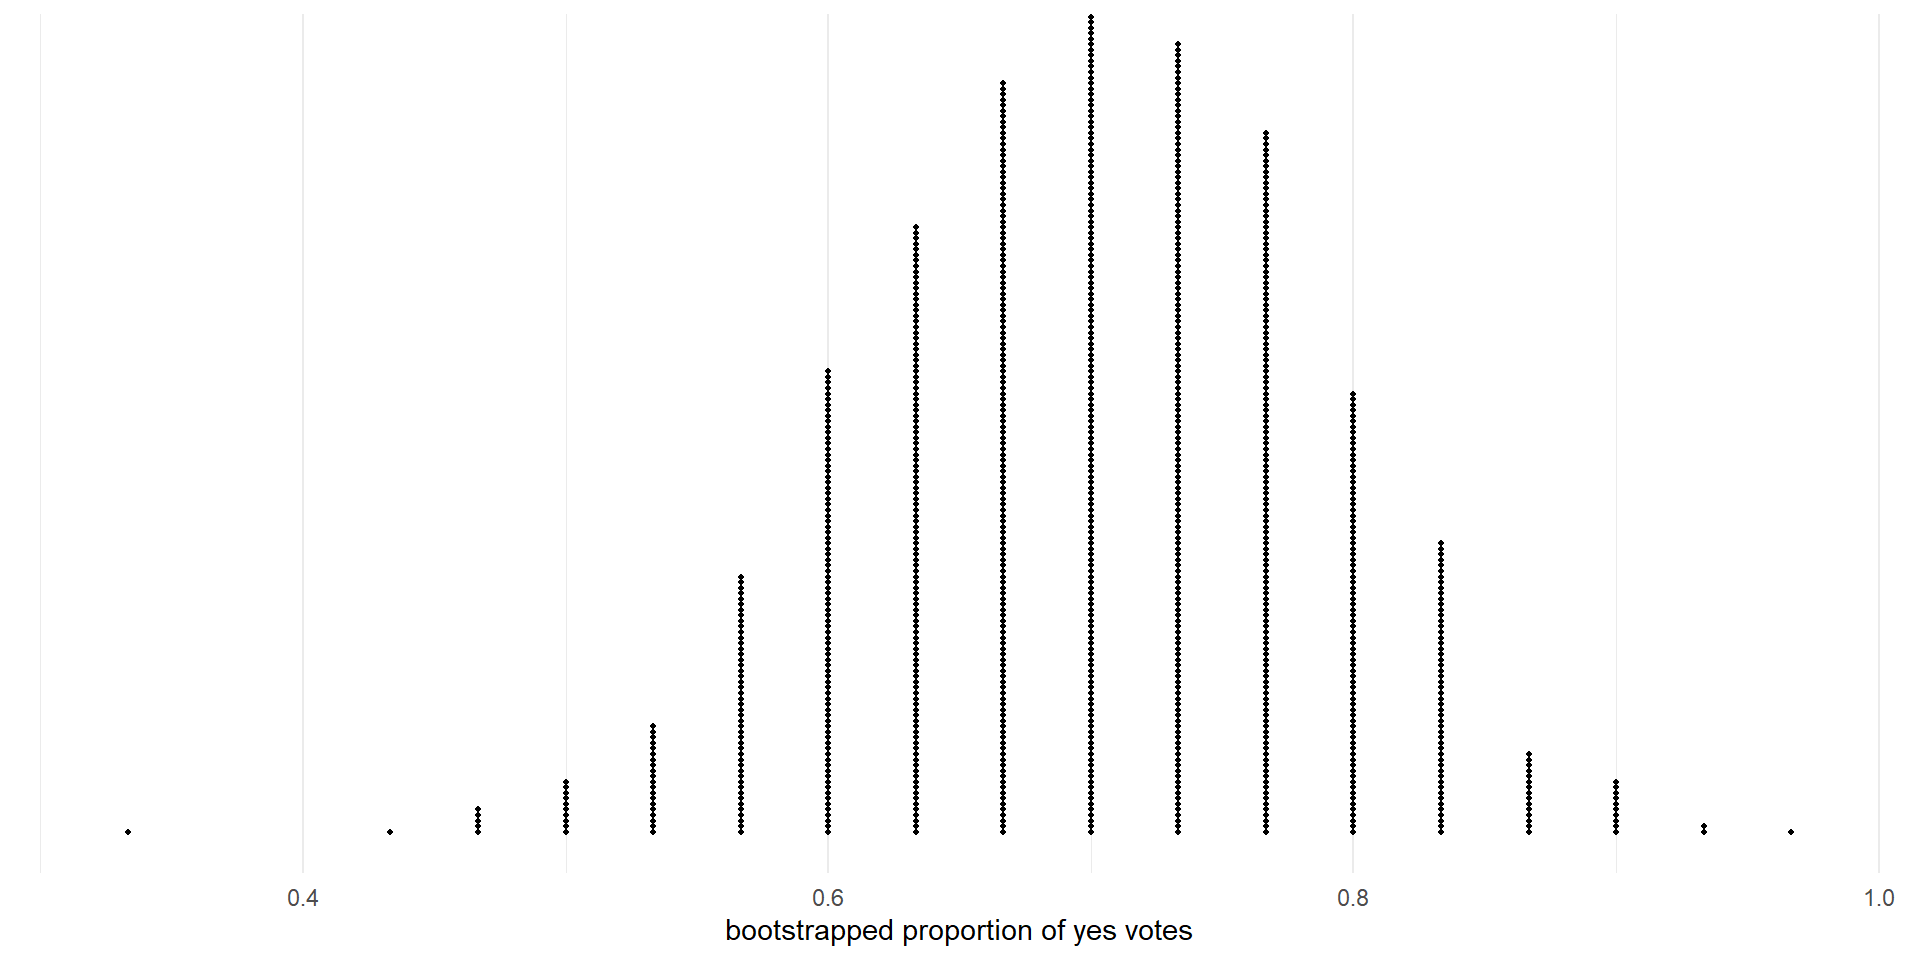
The bootstrapped proportion is estimated for each bootstrap sample. The resulting bootstrap distribution (dotplot) provides a measure for how the proportions vary from sample to sample. From IMS2 Figure 12.3.
Let’s select 1,000 bootstrapped sampled using the results from our one poll
We can calculate the standard error using the bootstrapped proportions
How does this bootstrap estimate compare the the true standard error?
one_poll_boot |>summarize(se_boot =sd(stat))
Bootstrap 95% Confidence Interval
The 95 % bootstrap percentile confidence interval for a parameter \(p\) is obtained by calculating the 2.5% and 97.5% percentiles for the bootstrapped statistics.
We say we are 95% confident that the value of the true proportion of yes votes is between 0.533 and 0.867
The confidence interval will contain the observed value of the statistic (usually near the center of the interval)
Larger sample sizes result in narrower confidence intervals (we are more confident that the parameter is close to the point estimate if the point estimate comes from a larger sample)
If we were to repeatedly sample from the population and calculate a 95% confidence interval from each sample, about 95% of the confidence intervals would contain the true value of the parameter
Why Do Bootstrap Confidence Intervals Work?
Illustration of sampling distribution and bootstrap distribution. From IMS2 Tutorial 4.4.
Bootstrap distribution has approximately same SE as sampling distribution
In sampling distribution 95% of values are within about 1.96 SE of the true value
95% bootstrap CI includes bootstrapped values within about 1.96 SE of the observed value of the statistic
Thus about 95% of confidence intervals will include the true value of the parameter
Treating Warts Bootstrap 95% Confidence Interval
Recall the study comparing treatment of warts by duct tape and cryotherapy in Ch. 11.
The difference in the sample proportion cured was 0.2462
With the significance level, \(\alpha\) = 0.05, we were 95% confident that the difference in the proportion cured between “Tape” and “Cryo” was greater than zero
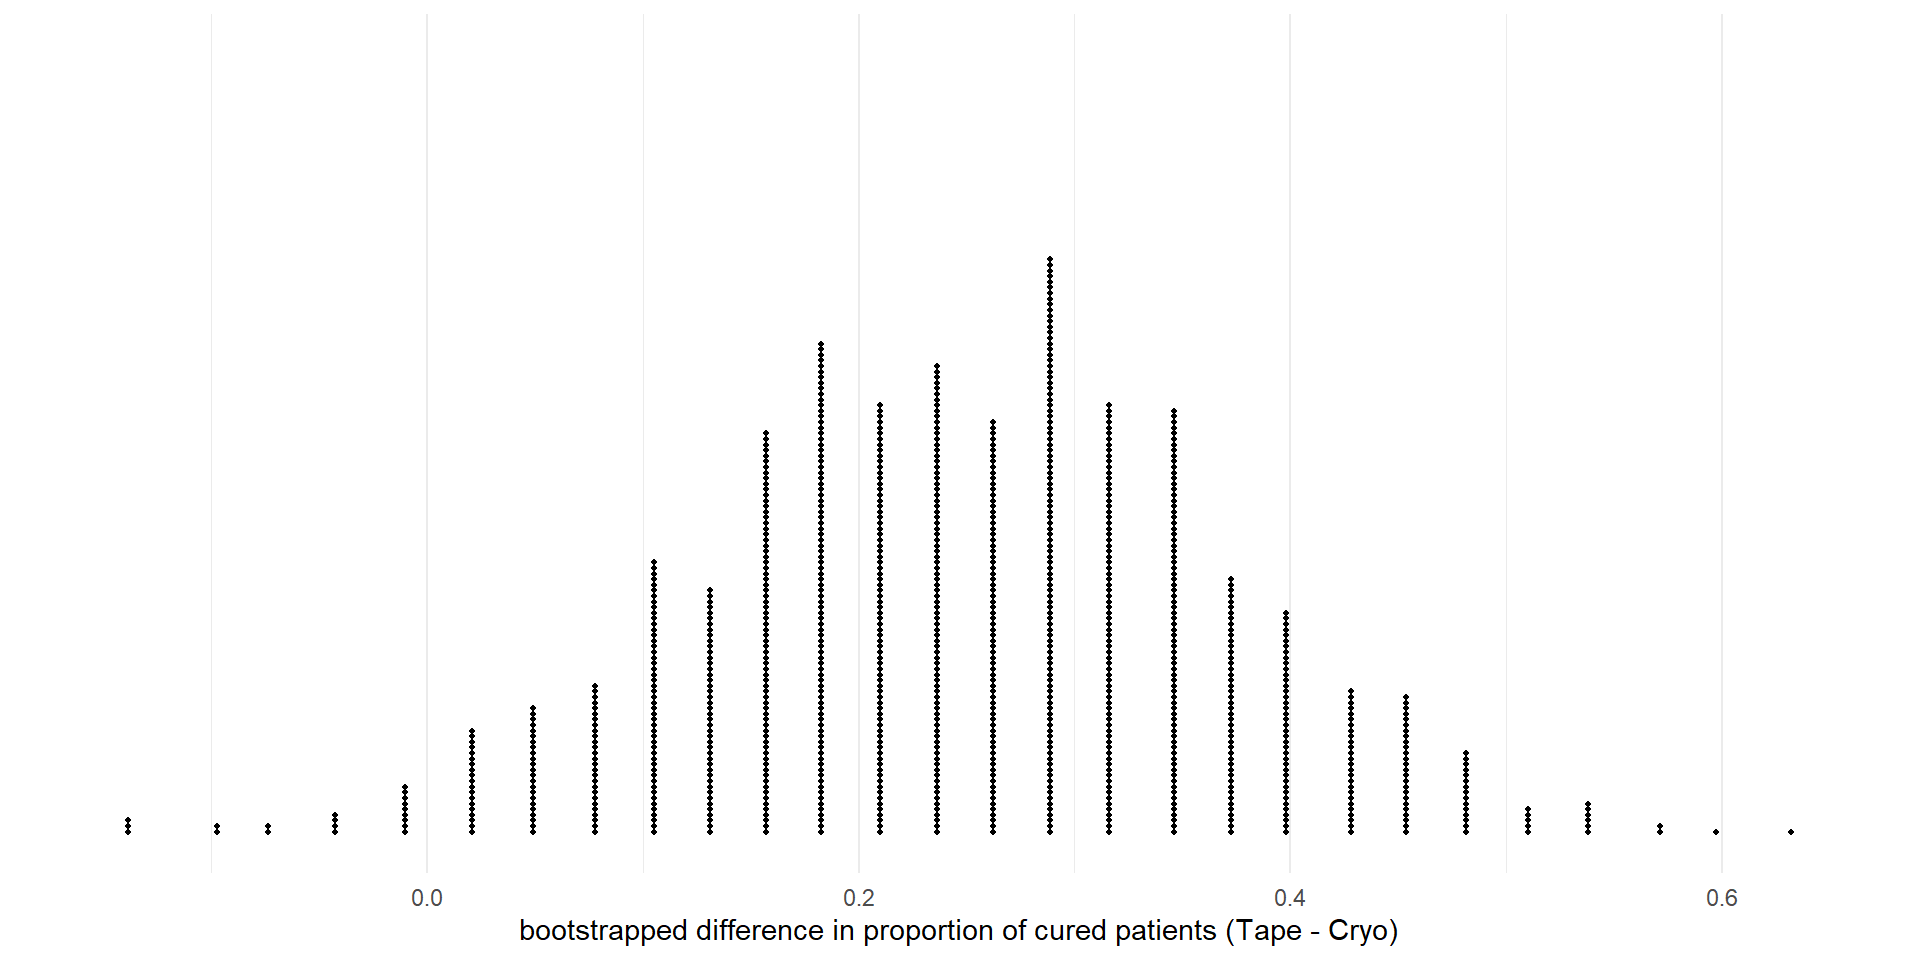
Now let’s look at the confidence interval of the difference in proportion cured
Here we plot the bootstraped distribution
duct_tape_boot <- duct_tape |>specify(result ~ treatment, success ="Cured") |>generate(reps =1000, type ="bootstrap") |>calculate(stat ="diff in props", order =c("Tape", "Cryo"))