Hypothesis Testing with Randomization
IMS2 Ch. 11
Math 219
Yurk and Martin
Treating Warts
- Research question: Is application of duct tape as effective as cryotherapy (freezing with liquid nitrogen) after 2 months of treatment for common warts?
- 2 variables
- treatment: Duct Tape or Cryotherapy
- cured : Cured or Not
- 51 individuals (26 treated with duct tape, 25 with cryotherapy)
Data from
The Efficacy of Duct Tape vs Cryotherapy in the Treatment of Verruca Vulgaris (the Common Wart)
by DR Focht III, C Spicer; MP Fairchok
in Arch Pediatr Adolesc Med. 2002;156:971-974
Results (EDA)
Difference in proportions
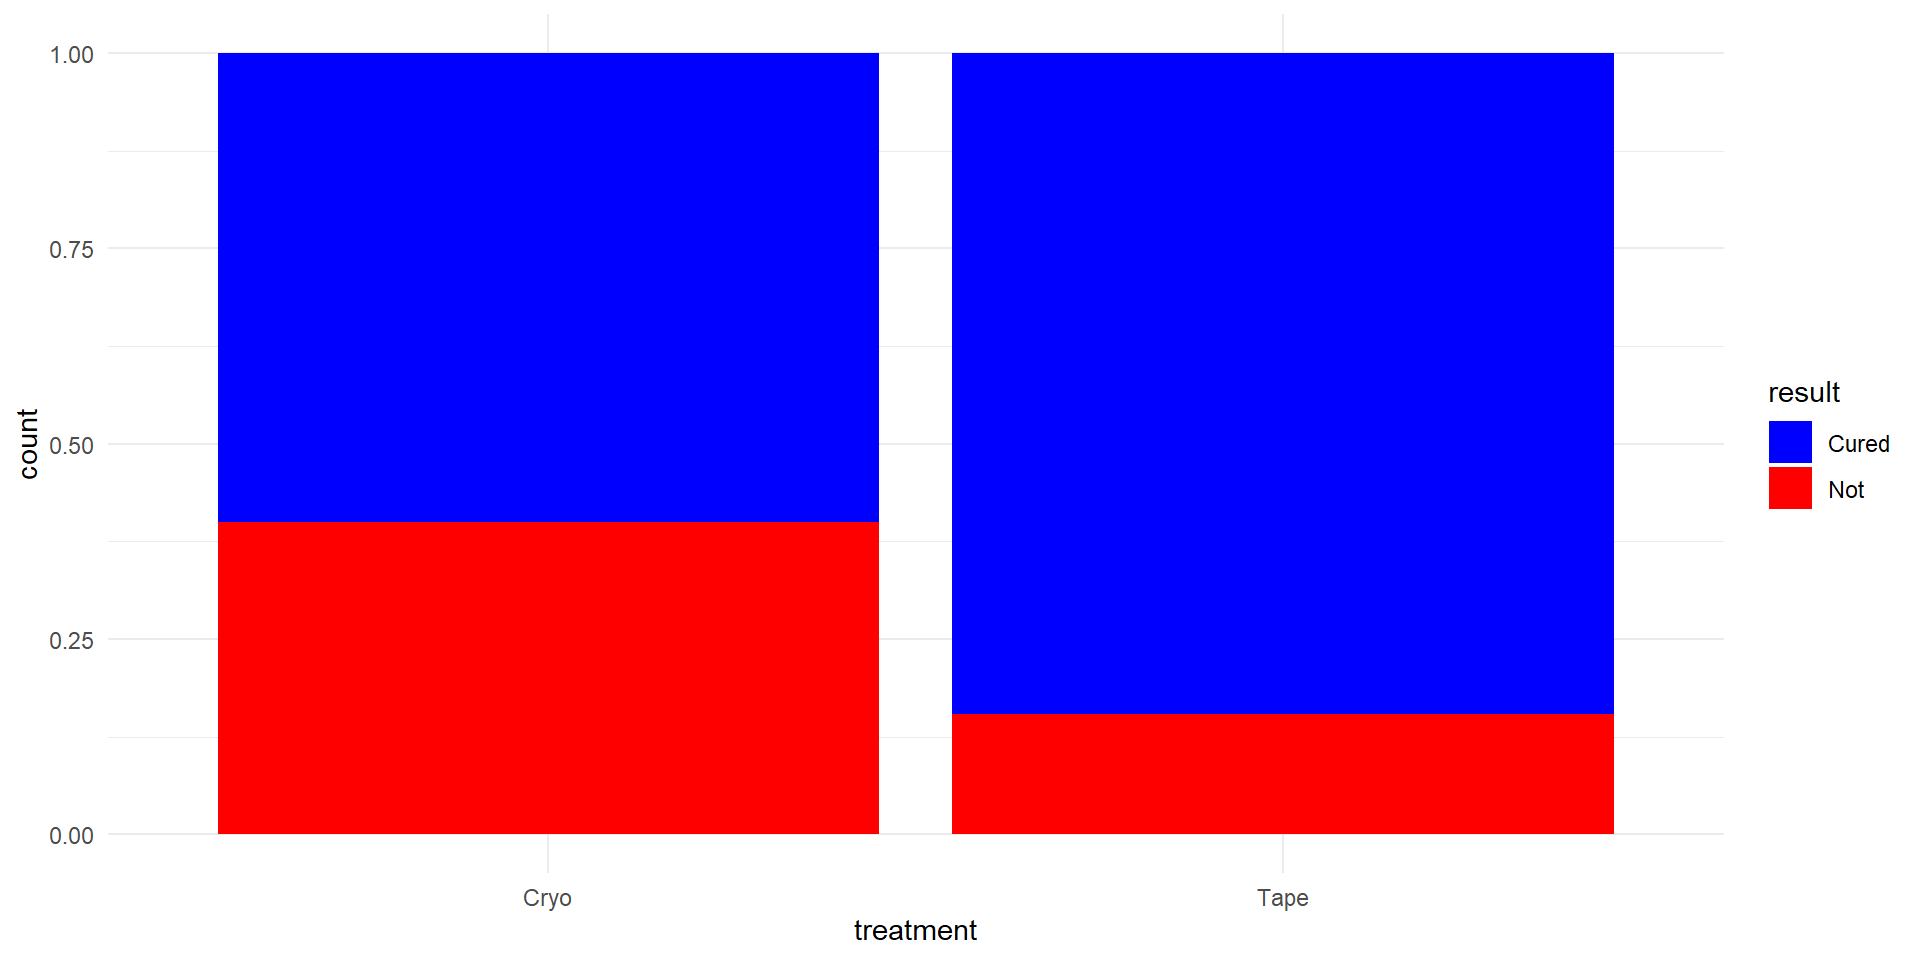
- Success: result = Cured
- Statistic of interest: difference in proportions \[\hat{p}_T-\hat{p}_C\]
- Observed difference: \[\frac{22}{26}-\frac{15}{25}=0.2462\]
Hypothesis Test
- From the sample it appears that the duct tape is a more effective treatment than cryotherapy
- It may be that there is no real difference in preference in the population, and the observed difference is not surprising when selecting a sample of this size from the population
- A hypothesis test states these two possibilities formally as hypotheses then weighs them against each other using the results from the sample as evidence
Hypotheses
- The null hypothesis, denoted \(H_0\), represents a skeptical perspective or a claim of no difference
- The alternative hypothesis, denote \(H_A\), represents an alternative claim of difference.
- As statisticians, we usually establish hypotheses before viewing the data in order to avoid bias
In words:
\(H_0:\) Treatment has no effect
on result. Those who were cured
of warts would have been cured
no matter which treatment.
\(H_A:\) The duct tape therapy
is more effective in treating
warts than cryotherapy.
In symbols:
\(H_0: p_T - p_C = 0\)
\(H_A: p_T - p_C > 0\)
Null Distribution
- We test the null hypothesis by comparing the observed value of the statistic to a null distribution
- If the null hypothesis is true and we select different samples of the same size from the population, we would expect the value of the statistic to vary between samples
- The null distribution is the distribution that describes those values
- It is an example of a sampling distribution (distribution of a statistic)
Simulation of a Null Distribution Using Cards
- We can perform a physical simulation of the duct tape therapy vs. cryotherapy treatment of warts
- Form six groups with a deck of playing cards for each group
- There are 51 observations in this study, so remove one of the aces and the jokers from your deck
- There are 37 patients who were cured and 14 patients who were not.
- We’ll use the red cards from 2 through 8 to represent the 14 who weren’t cured
- The other cards represent the 37 who were cured
- To simulate the null hypothesis being true (no difference between the therapies), shuffle the cards and put them in two piles of 26 (duct tape) and 25 (cryotherapy)
- Count the number not cured in the duct tape sample (the pile of 26), determine how many were cured and calculate the proportion cured in each pile and the sample statistic which is the difference in proportions, \[\hat{p}_T-\hat{p}_C\]
- Do this twice in your group and record your statistics to two digits in the Google sheet linked in Week 4 of the Moodle page
Null Distribution Using Random Permutation
- Mixing up the values of the response variable we simulated for the treating warts study is called random permutation
- We used random permutation with the playing cards to create a null distribution
- Usually we will do this with a computer, because we want to calculate the statistic for 1,000 or 10,000 random permutations
Here is the original wart treatment data with 5 random permutations.
- Now let’s simulate 100 samples assuming true null hypothesis
- We’ll calculate a difference in proportions for each permutation
- Use
inferpackage
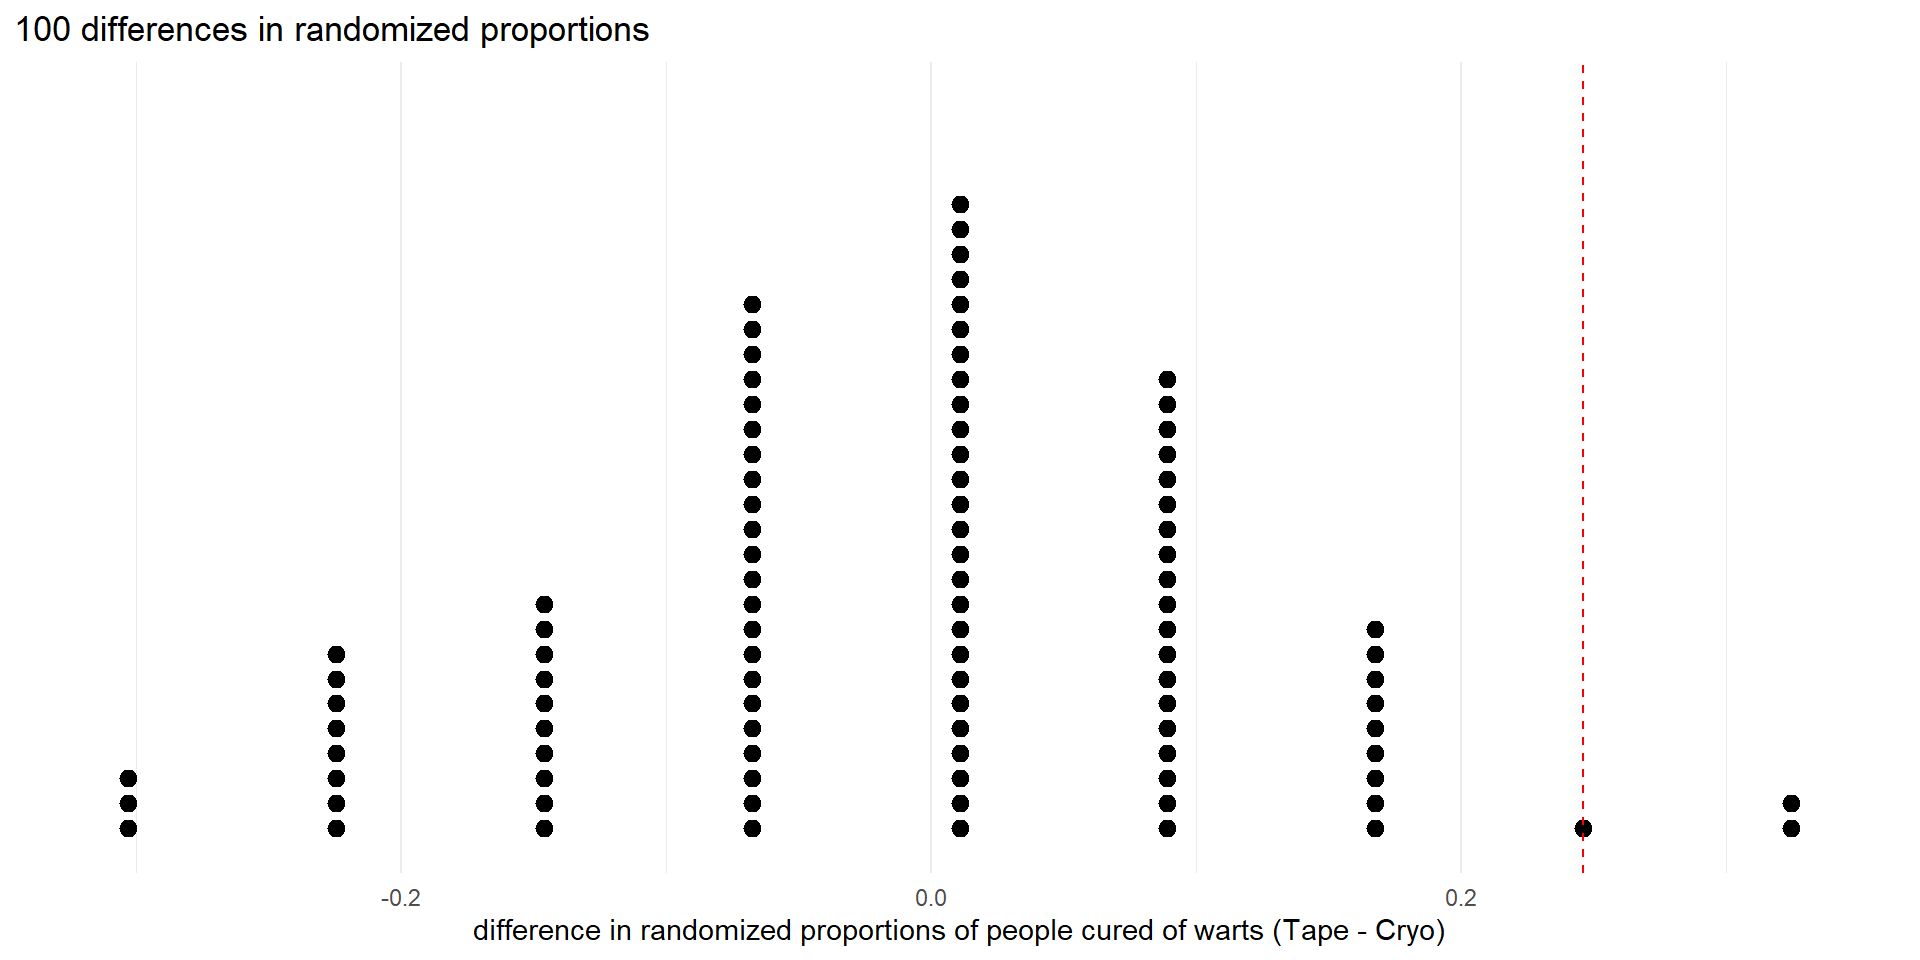
Dot plot of 100 differences in randomized proportions (null distribution), showing observed difference as dashed vertical line.
p-Value
- To test the null hypothesis (\(p_T-p_C = 0\)) we consider how probable it would be to get a difference in proportions that is at least as large as the observed difference if \(H_0\) is true
- This probability is called a p-value
- We use the null distribution to calculate the p-value
There are 3 differences in randomization proportions that are greater than or equal to the observed value (0.2462). So we estimate the p-value to be 3/100 = 0.03
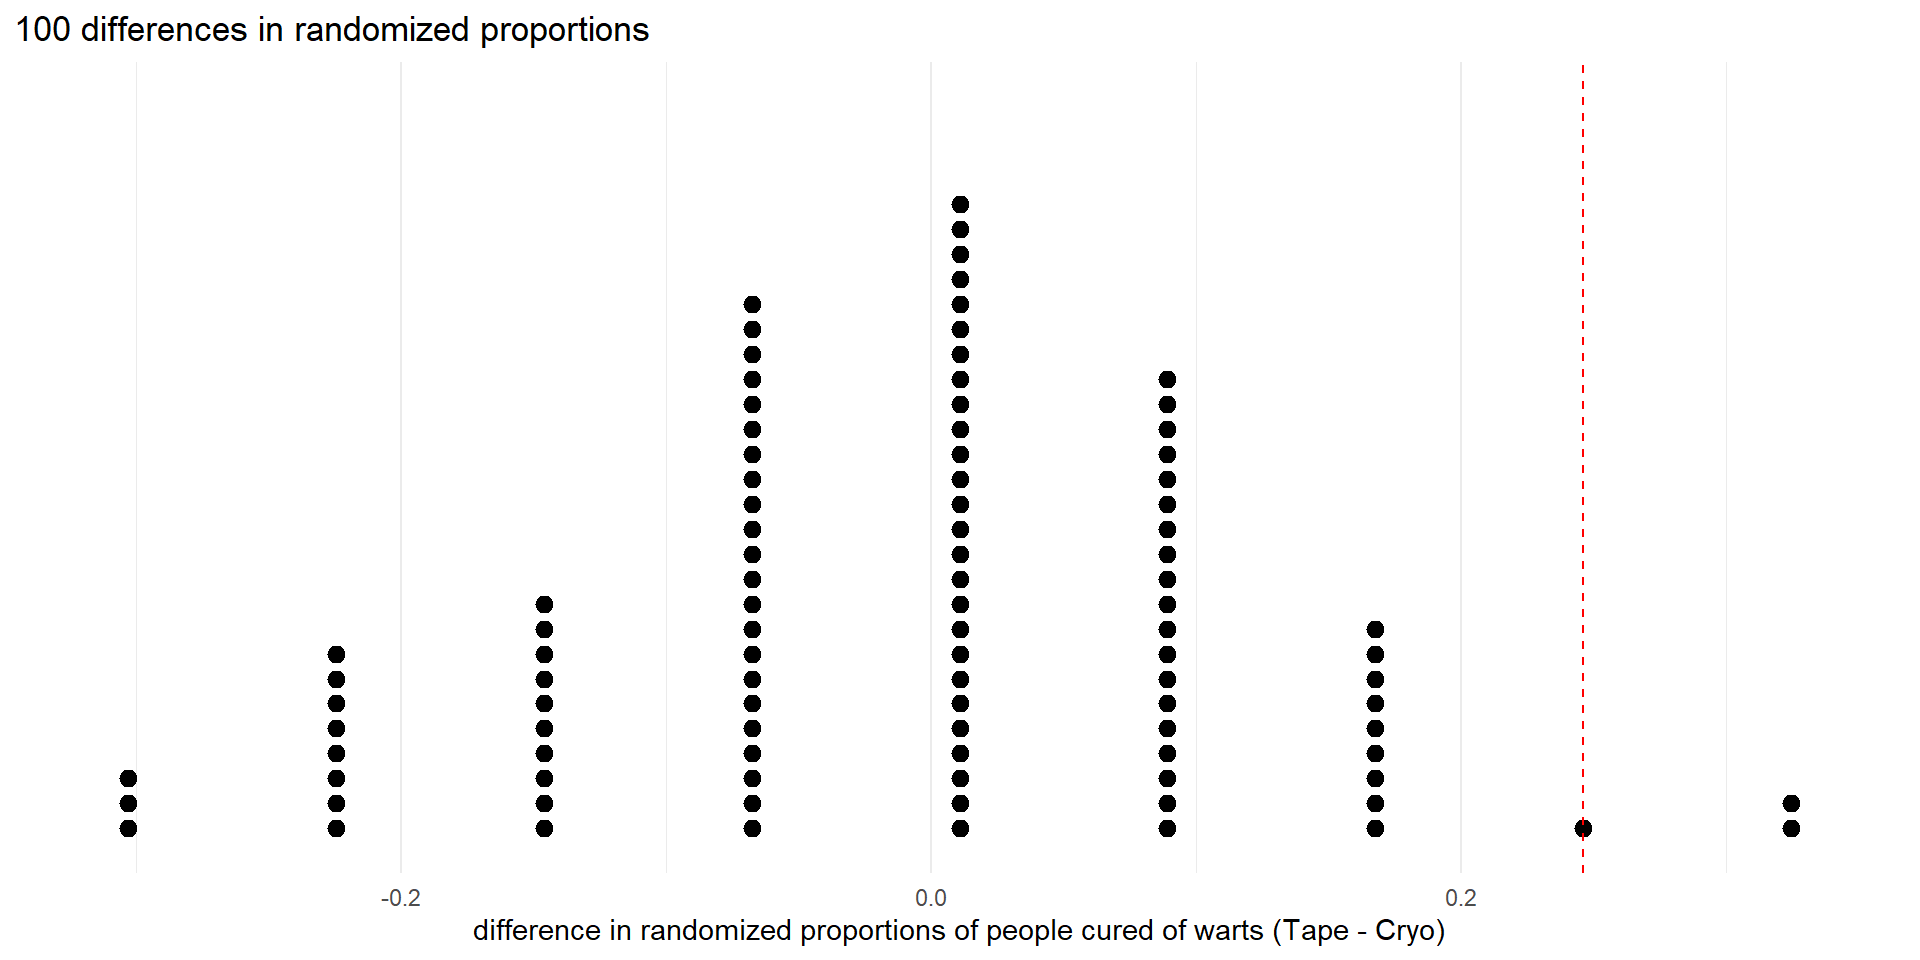
Dot plot of 100 differences in randomized proportions (null distribution), showing observed difference as dashed vertical line.
Significance Level
- Before we conduct a study, we define a significance level, denoted \(\alpha\)
- We decide that in order to reject the null hypothesis as false, the p-value must be less than \(\alpha\)
- The significance level is the standard of evidence we will use to judge the null hypothesis
- We presume the null hypothesis is true, but we are willing to reject it if the evidence against it is strong enough (the p-value is less than \(\alpha\))
- Typical values for \(\alpha\) are 0.05 and 0.01
- Sometimes other values are used
- Unless otherwise noted, we will always use \(\alpha = 0.05\)
Conclusion
- In the wart treatment example, the observed difference in proportions (\(\hat{p}_T-\hat{p}_C = 0.2462\)) allows us to reject the null hypothesis (p = 0.03) at the \(\alpha = .05\) significance level.
- The difference in the proportions is statistically significant
- This means that there is a significant difference in the proportion of people who were cured of warts between the duct tape therapy and the cryotherapy.