Rows: 3,142
Columns: 4
$ state      <chr> "Alabama", "Alabama", "Alabama", "Alabama", "Alabama", "Ala…
$ county     <chr> "Autauga County", "Baldwin County", "Barbour County", "Bibb…
$ expectancy <dbl> 76.060, 77.630, 74.675, 74.155, 75.880, 71.790, 73.730, 73.…
$ income <dbl> 37773, 40121, 31443, 29075, 31663, 25929, 33518, 33418, 312…Exploring Numerical Data
IMS1 Ch. 5
Math 215
Yurk
Life Expectancies
- Every county in the US (3,142 counties)
- Variables include county name, state, average life expectancy (expectancy), median income (income)
- Life expectancy data data is in a data set called
life - Let’s glimpse the data
Pipes in R
- We will often use pipes to pass data to functions in R
- Emphasizes the flow of data through a series of processing steps
- The following code uses a pipe to glimpse the
lifedata:
Rows: 3,142
Columns: 4
$ state      <chr> "Alabama", "Alabama", "Alabama", "Alabama", "Alabama", "Ala…
$ county     <chr> "Autauga County", "Baldwin County", "Barbour County", "Bibb…
$ expectancy <dbl> 76.060, 77.630, 74.675, 74.155, 75.880, 71.790, 73.730, 73.…
$ income     <dbl> 37773, 40121, 31443, 29075, 31663, 25929, 33518, 33418, 312…
Filtering data in R
- We will focus on life expectancy in Massachusetts (14 counties)
- We will filter the data to obtain a subset of the observations – just the ones for Massachusetts counties
- We give the filtered data set a new name
- Let’s glimpse the resulting data set
Rows: 14
Columns: 4
$ state      <chr> "Massachusetts", "Massachusetts", "Massachusetts", "Massach…
$ county     <chr> "Barnstable County", "Berkshire County", "Bristol County", …
$ expectancy <dbl> 80.325, 79.780, 78.975, 80.995, 80.415, 80.070, 78.420, 80.…
$ income     <dbl> 64730, 50712, 48294, 78745, 60320, 48428, 46216, 46756, 732…
Selecting columns
filtergives us a subset of the rows in a data frameselectgives us a subset of the columns- We are interested in the life expectancy in different MA counties
- Let’s select just the
countyandexpectancycolumns
- Let’s glimpse the resulting data set
Mutating columns
- We can use the
mutatefunction to create new columns from existing columns or to manipulate existing columns - Let’s round the life expectancies to whole numbers
- Let’s glimpse the resulting data set
- We can chain several operations together with pipes
- Data flows from left to right through the pipeline
- The following code chains all of the operations together that we just performed
Life Expectancies in MA Counties
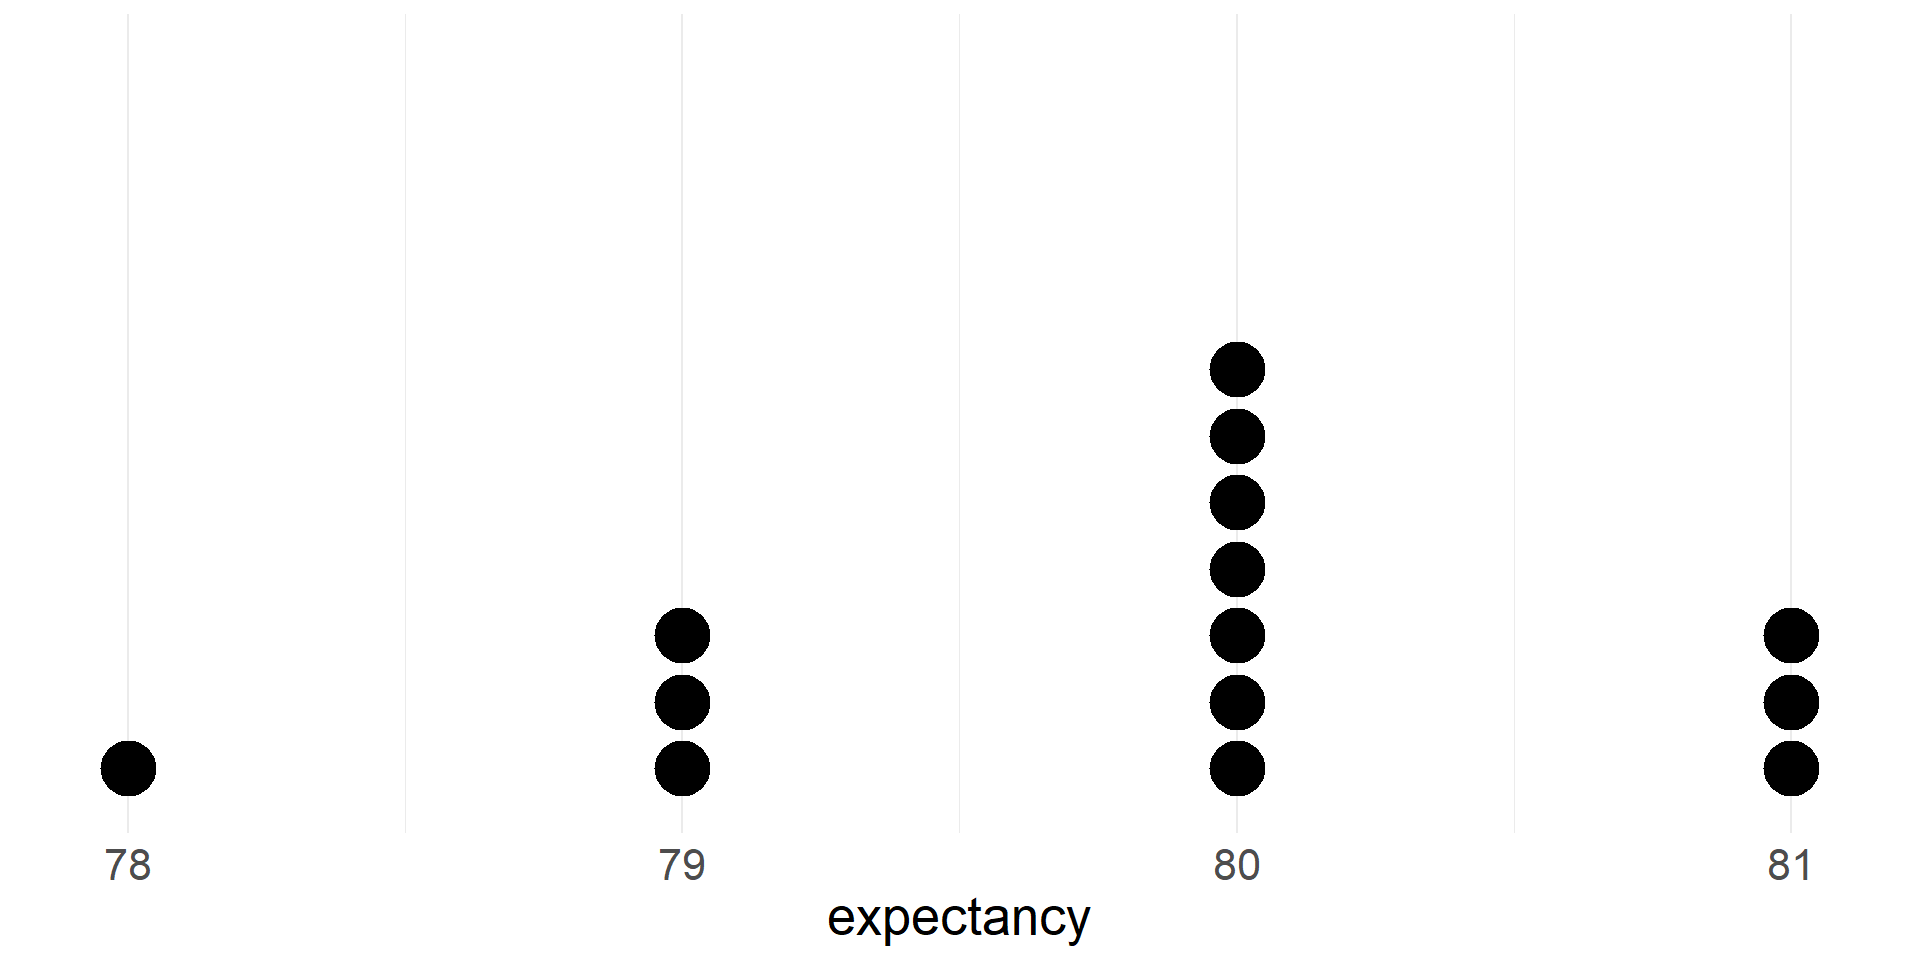
- Let’s take a quick peak at a dotplot of life expectancies for the MA counties
Summaries of numerical data
Measures of center
- mean
- median
Percentiles/quantiles
- quartiles
- other percentiles
Measures of spread
- interquartile range
- standard deviation
Mean
- If there are \(n\) cases in a sample then the sample mean of the numeric variable \(x\) is \[\bar{x}=\frac{x_1+x_2+\cdots+x_n}{n}\]
- The sample mean is a measure of the center of the distribution of the data
- The sample mean \(\bar{x}\) (a statistic) gives us a point estimate of the population mean \(\mu\) (a parameter)
- We can compute the mean of the life expectancy variable by extracting that column from the data and computing the mean.
Or we can use the summarize function.
Median
- The median is the value that splits the data in half
- 50% of the data fall below the median
- We can also compute the median of the life expectancy data
- We will add it to the summary
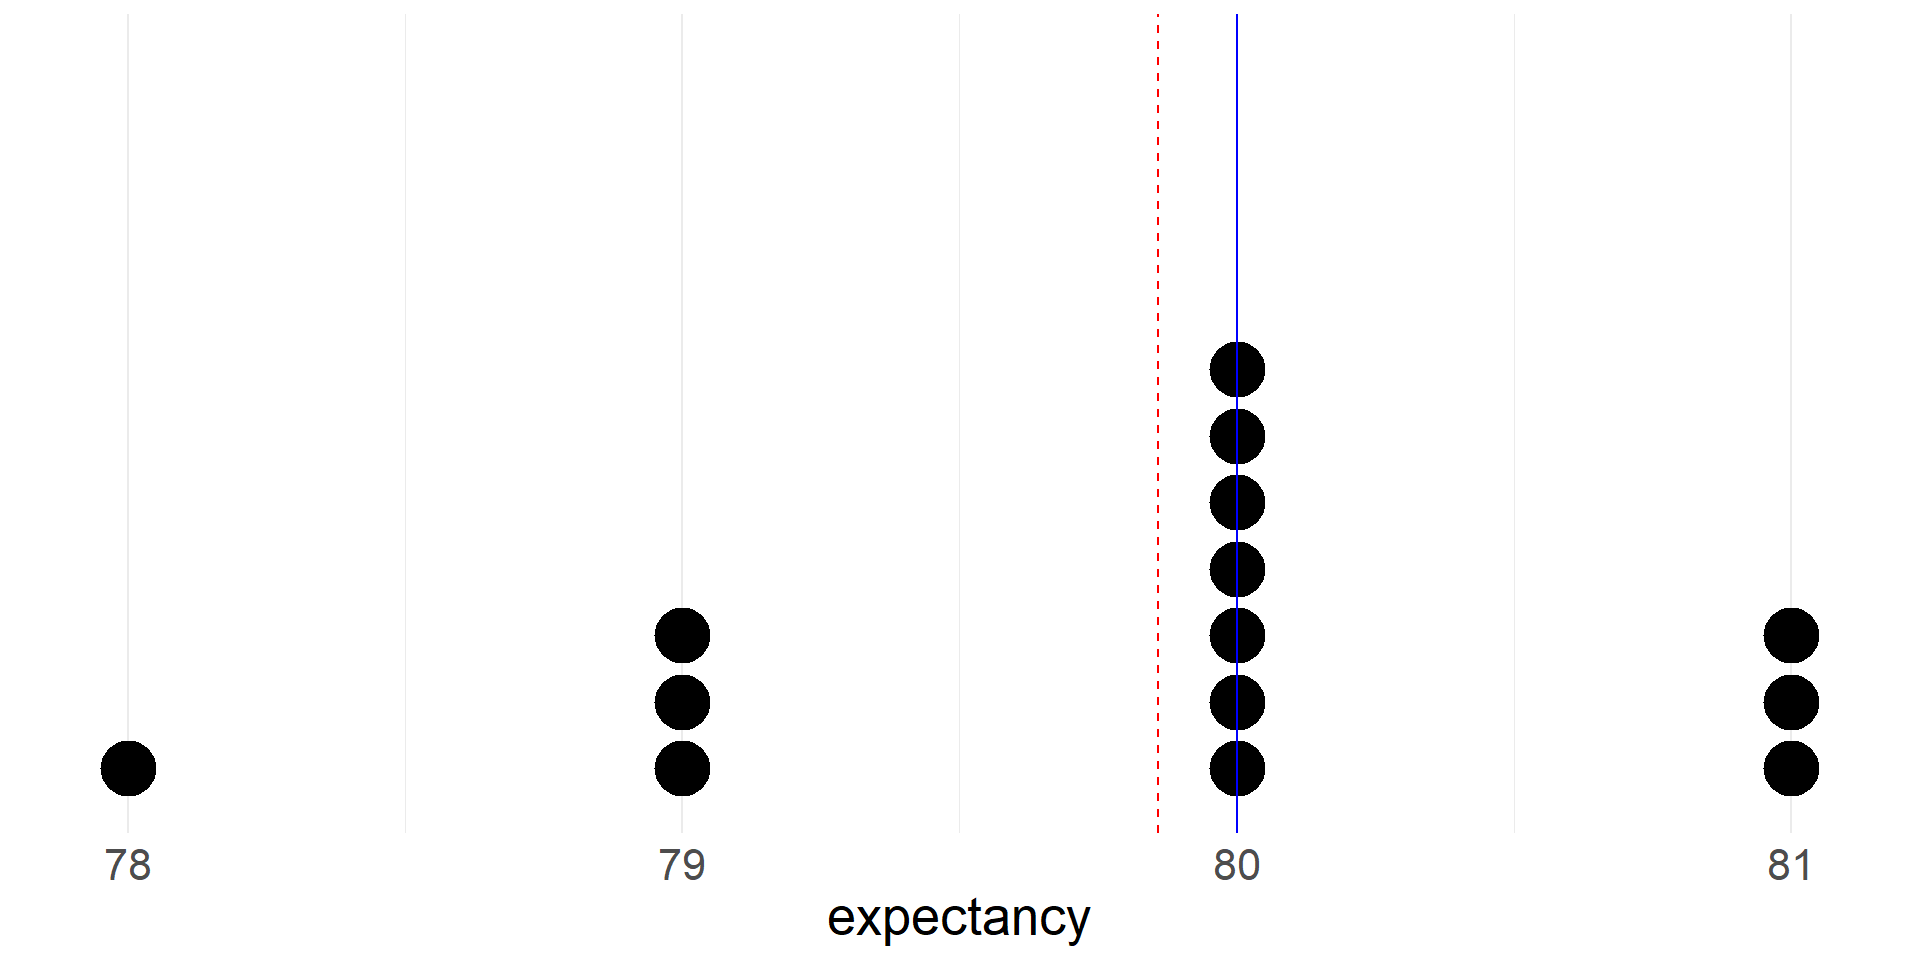
- Let’s see where the mean and median fall on the dotplot
- The mean is red and dashed. Note that it is pulled toward the thicker left tail of the distribution.
Group means
- We can also compare means between different groups in the data
- Let’s compare the mean of the life expectancy variable between counties in West Coast states (California, Oregon, Washington) and counties that are not in West Coast states
- First we add a new variable to the full data set that indicates whether a county is in a West Coast state
- Let’s glimpse the resulting data set
Rows: 3,142
Columns: 5
$ state      <chr> "Alabama", "Alabama", "Alabama", "Alabama", "Alabama", "Ala…
$ county     <chr> "Autauga County", "Baldwin County", "Barbour County", "Bibb…
$ expectancy <dbl> 76.060, 77.630, 74.675, 74.155, 75.880, 71.790, 73.730, 73.…
$ income     <dbl> 37773, 40121, 31443, 29075, 31663, 25929, 33518, 33418, 312…
$ west_coast <chr> "no", "no", "no", "no", "no", "no", "no", "no", "no", "no",…- Next we group the data using the new
west_coastvariable - Then we use the
summarizefunction to compute group means and medians - Is life expectancy higher in counties in west coast states?
Percentiles
- The Xth percentile is the value below which X% of the data fall
- The median is the 50th percentile
- Let’s compute the 90th percentile of the life expectancy variable in the Massachusetts data
Quartiles
- The first quartile (Q1) is the 25th percentile, the value below which 25% of the data fall
- The third quartile (Q3) is the 75th percentile, the value below which 75% of the data fall
- The median is sometimes described as the second quartile (Q2)
- Quartiles are often included in numerical summaries of a data set
- Let’s add quartiles to our summary of the Massachusetts data
Maximum and minimum values
- Maximum and minimum values in a data set are often included numerical summaries as well
- Let’s add them to our summary of the Massachusetts data
- Note that there is also a convenient
summaryfunction that we can use to summarize every variable in the data - However, this format is inconvenient to use in downstream computations.
Range
- The simplest measure of spread/variability of a distribution of data is the range
- It is simply the difference between the largest and smallest values
Interquartile range
- The interquartile range (IQR) is the difference Q3-Q1
- The IQR will never be larger than the range!
- It can be computed from the quartiles, or using the
IQRfunction.
Standard deviation
- The most commonly used measure of variability is the standard deviation
- The deviation of a single observation \(i\) is the difference between the observed value and the mean, \(x_i - \bar{x}\)
- The standard deviation describes the typical deviation of the data from the mean
- The sample variance is the average squared deviance \[s^2=\frac{(x_1-\bar{x})^2 + (x_2-\bar{x})^2 \cdots (x_n-\bar{x})^2}{n-1}\]
- We divide by \(n-1\) rather than \(n\) (the sample size) to obtained an unbiased estimate of the population variance \(\sigma^2\). Otherwise \(s^2\) tends to underestimate \(\sigma^2\)
- The sample standard deviation is \[s = \sqrt{s^2} = \sqrt{\frac{\sum_{i=1}^n(x_i-\bar{x})^2}{n-1}}\]
For many numeric variables the following rules of thumb apply:
- Roughly 68% of the data fall within 1 standard deviation of the mean
- Roughly 95% of the data fall within 2 standard deviations of the mean
- We can use the
sdfunction to compute the sample standard deviation
Identifying outliers using IQR
- An outlier is an observation that is extreme relative to the rest of the data
- There is no universally accepted method for identifying outliers
- One common method that is also simple uses the IQR
- With this method, a point is considered an outlier if it is larger than Q3 or smaller than Q1 by more than \(1.5\times\)IQR.
- Let’s use this method to identify outliers in the life expectancy data for the whole country
- There are 12 counties identified as outliers
- All of them have low life expectancies
# A tibble: 12 × 4
   state         county             expectancy is_outlier
   <chr>         <chr>                   <dbl> <lgl>
 1 Arkansas      Mississippi County       70.9 TRUE
 2 Arkansas      Phillips County          70.9 TRUE
 3 Kentucky      Perry County             69.6 TRUE
 4 Mississippi   Bolivar County           69.7 TRUE
 5 Mississippi   Coahoma County           70.7 TRUE
 6 Mississippi   Quitman County           70.0 TRUE
 7 Mississippi   Sunflower County         70.4 TRUE
 8 Mississippi   Tunica County            70.0 TRUE
 9 Mississippi   Washington County        70.6 TRUE
10 Virginia      Petersburg City          70.7 TRUE
11 West Virginia Mcdowell County          68.4 TRUE
12 West Virginia Mingo County             70.6 TRUE
Cars
- data on all new car models (428) in a certain year
- 19 variables
- includes weight, highway mpg (hwy_mpg), msrp, whether a pickup or not (pickup)
- we will explore a variety of visualizations involving numerical variables
- Let’s glimpse the data
Rows: 428
Columns: 19
$ name        <chr> "Chevrolet Aveo 4dr", "Chevrolet Aveo LS 4dr hatch", "Chev…
$ sports_car  <lgl> FALSE, FALSE, FALSE, FALSE, FALSE, FALSE, FALSE, FALSE, FA…
$ suv         <lgl> FALSE, FALSE, FALSE, FALSE, FALSE, FALSE, FALSE, FALSE, FA…
$ wagon       <lgl> FALSE, FALSE, FALSE, FALSE, FALSE, FALSE, FALSE, FALSE, FA…
$ minivan     <lgl> FALSE, FALSE, FALSE, FALSE, FALSE, FALSE, FALSE, FALSE, FA…
$ pickup      <lgl> FALSE, FALSE, FALSE, FALSE, FALSE, FALSE, FALSE, FALSE, FA…
$ all_wheel   <lgl> FALSE, FALSE, FALSE, FALSE, FALSE, FALSE, FALSE, FALSE, FA…
$ rear_wheel  <lgl> FALSE, FALSE, FALSE, FALSE, FALSE, FALSE, FALSE, FALSE, FA…
$ msrp        <int> 11690, 12585, 14610, 14810, 16385, 13670, 15040, 13270, 13…
$ dealer_cost <int> 10965, 11802, 13697, 13884, 15357, 12849, 14086, 12482, 12…
$ eng_size    <dbl> 1.6, 1.6, 2.2, 2.2, 2.2, 2.0, 2.0, 2.0, 2.0, 2.0, 2.0, 1.7…
$ ncyl        <int> 4, 4, 4, 4, 4, 4, 4, 4, 4, 4, 4, 4, 4, 4, 4, 4, 4, 4, 4, 4…
$ horsepwr    <int> 103, 103, 140, 140, 140, 132, 132, 130, 110, 130, 130, 115…
$ city_mpg    <int> 28, 28, 26, 26, 26, 29, 29, 26, 27, 26, 26, 32, 36, 32, 29…
$ hwy_mpg     <int> 34, 34, 37, 37, 37, 36, 36, 33, 36, 33, 33, 38, 44, 38, 33…
$ weight      <int> 2370, 2348, 2617, 2676, 2617, 2581, 2626, 2612, 2606, 2606…
$ wheel_base  <int> 98, 98, 104, 104, 104, 105, 105, 103, 103, 103, 103, 103, …
$ length      <int> 167, 153, 183, 183, 183, 174, 174, 168, 168, 168, 168, 175…
$ width       <int> 66, 66, 69, 68, 69, 67, 67, 67, 67, 67, 67, 67, 67, 68, 66…
Dotplot
- A dotplot represents each case with a dot
- Dots are stacked on top of each other at the appropriate location on the x-axis
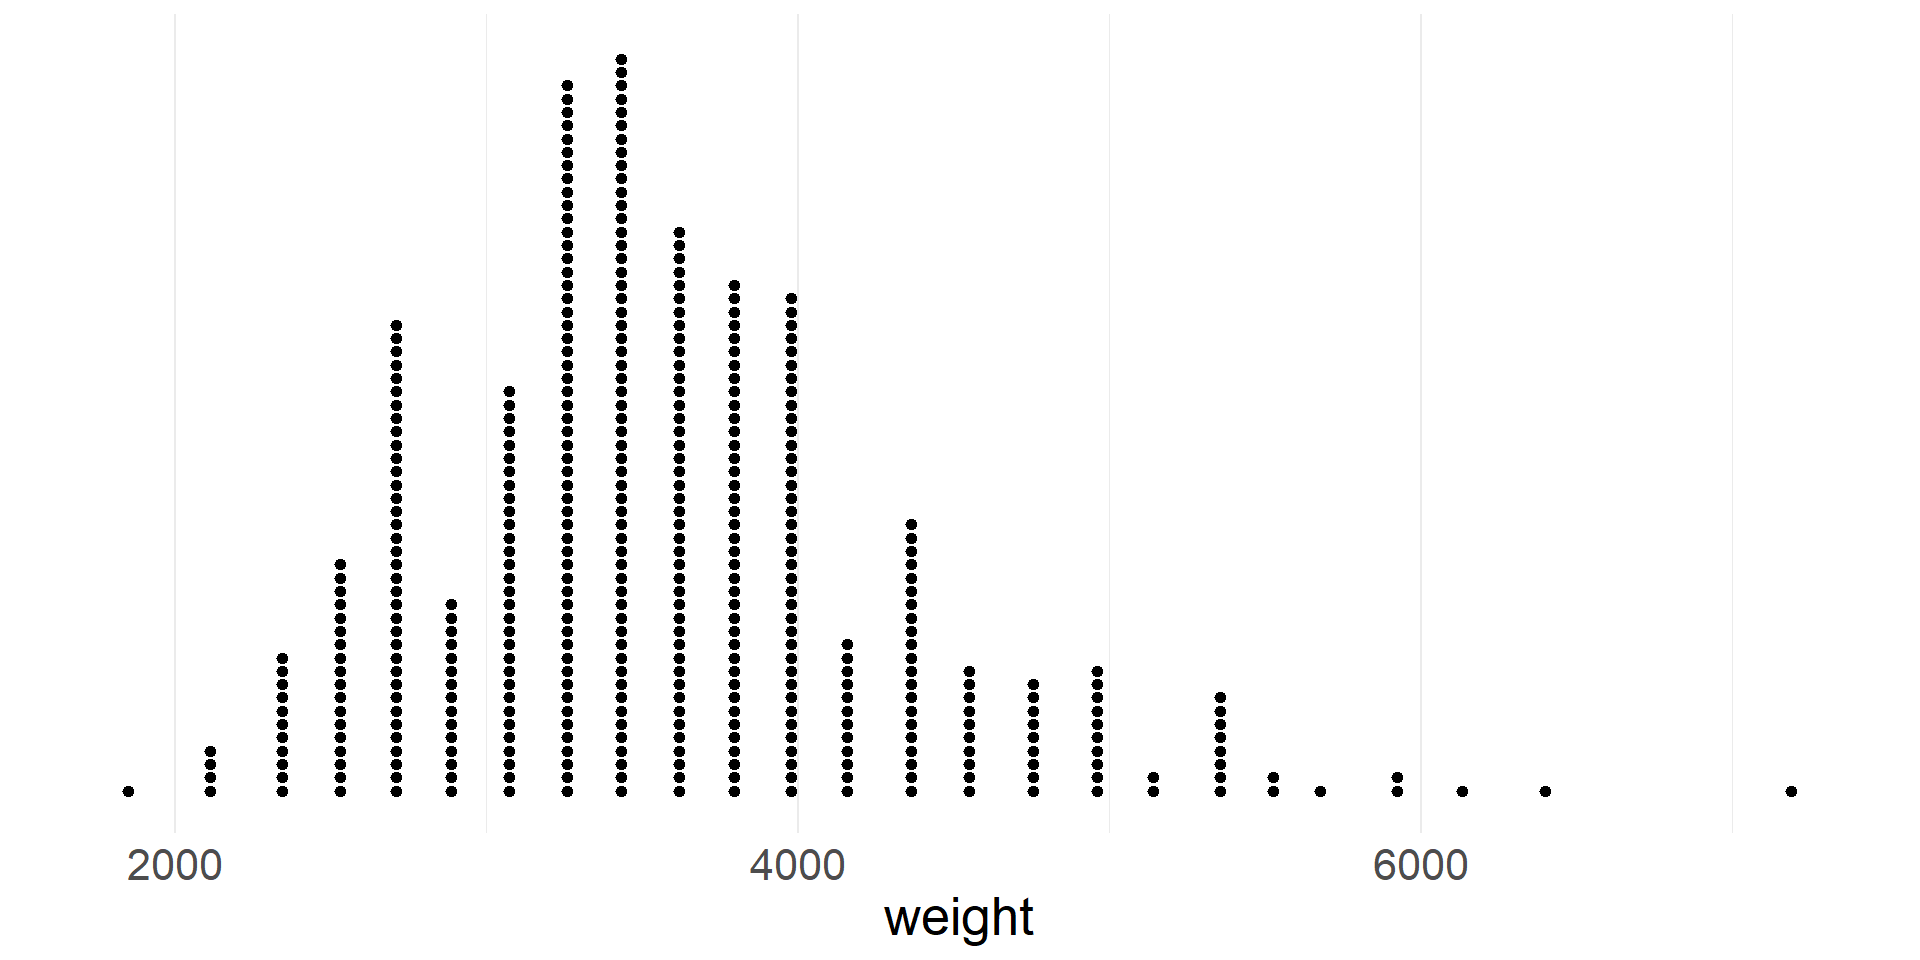
- Let’s create a dot plot of vehicle weights
- By default ggplot does not produce a useful y-axis scale, so we hide it
Skew and Symmetry
- Note that the distribution of weights is skewed right, meaning that it has a thicker tail on the right side
- A distribution with a thicker tail on the left is skewed left
- A distribution that is roughly equal in both directions is called symmetric
Histogram
- In a histogram data are aggregated into bins on the x-axis
- The height of each bar is proportional to the number of cases in the bin
- Let’s create a histogram of vehicle weights
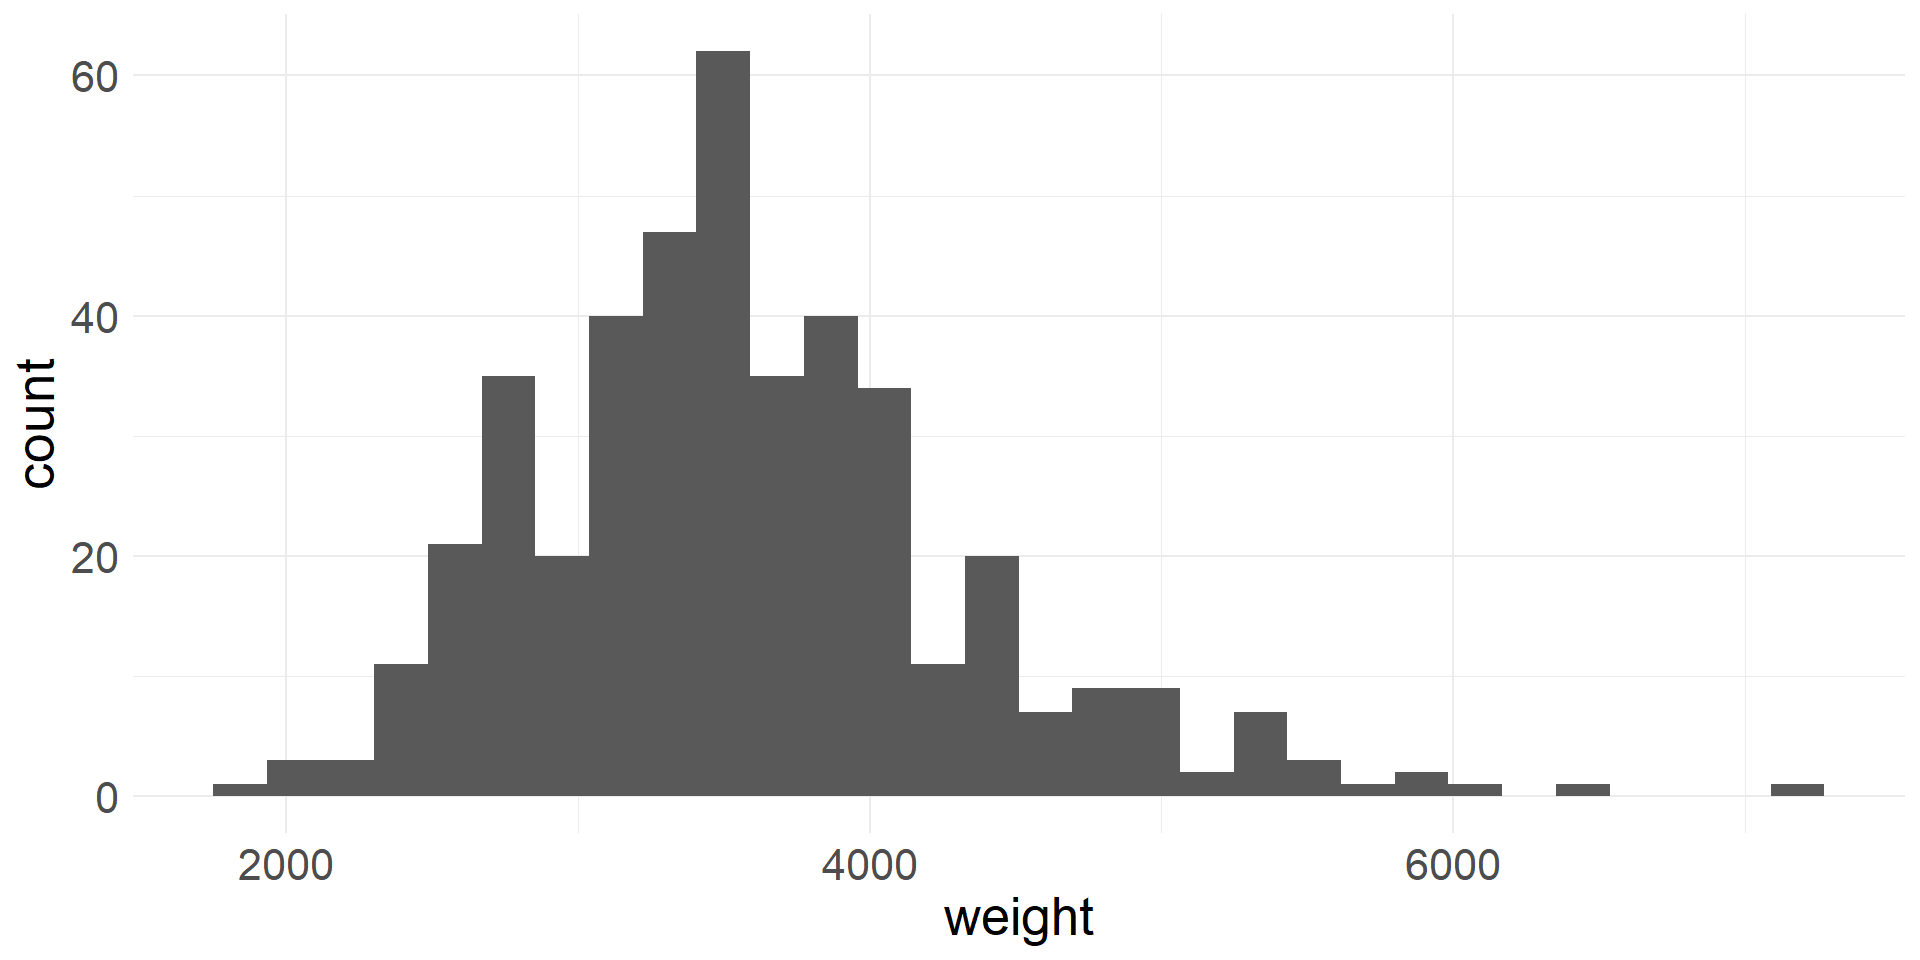
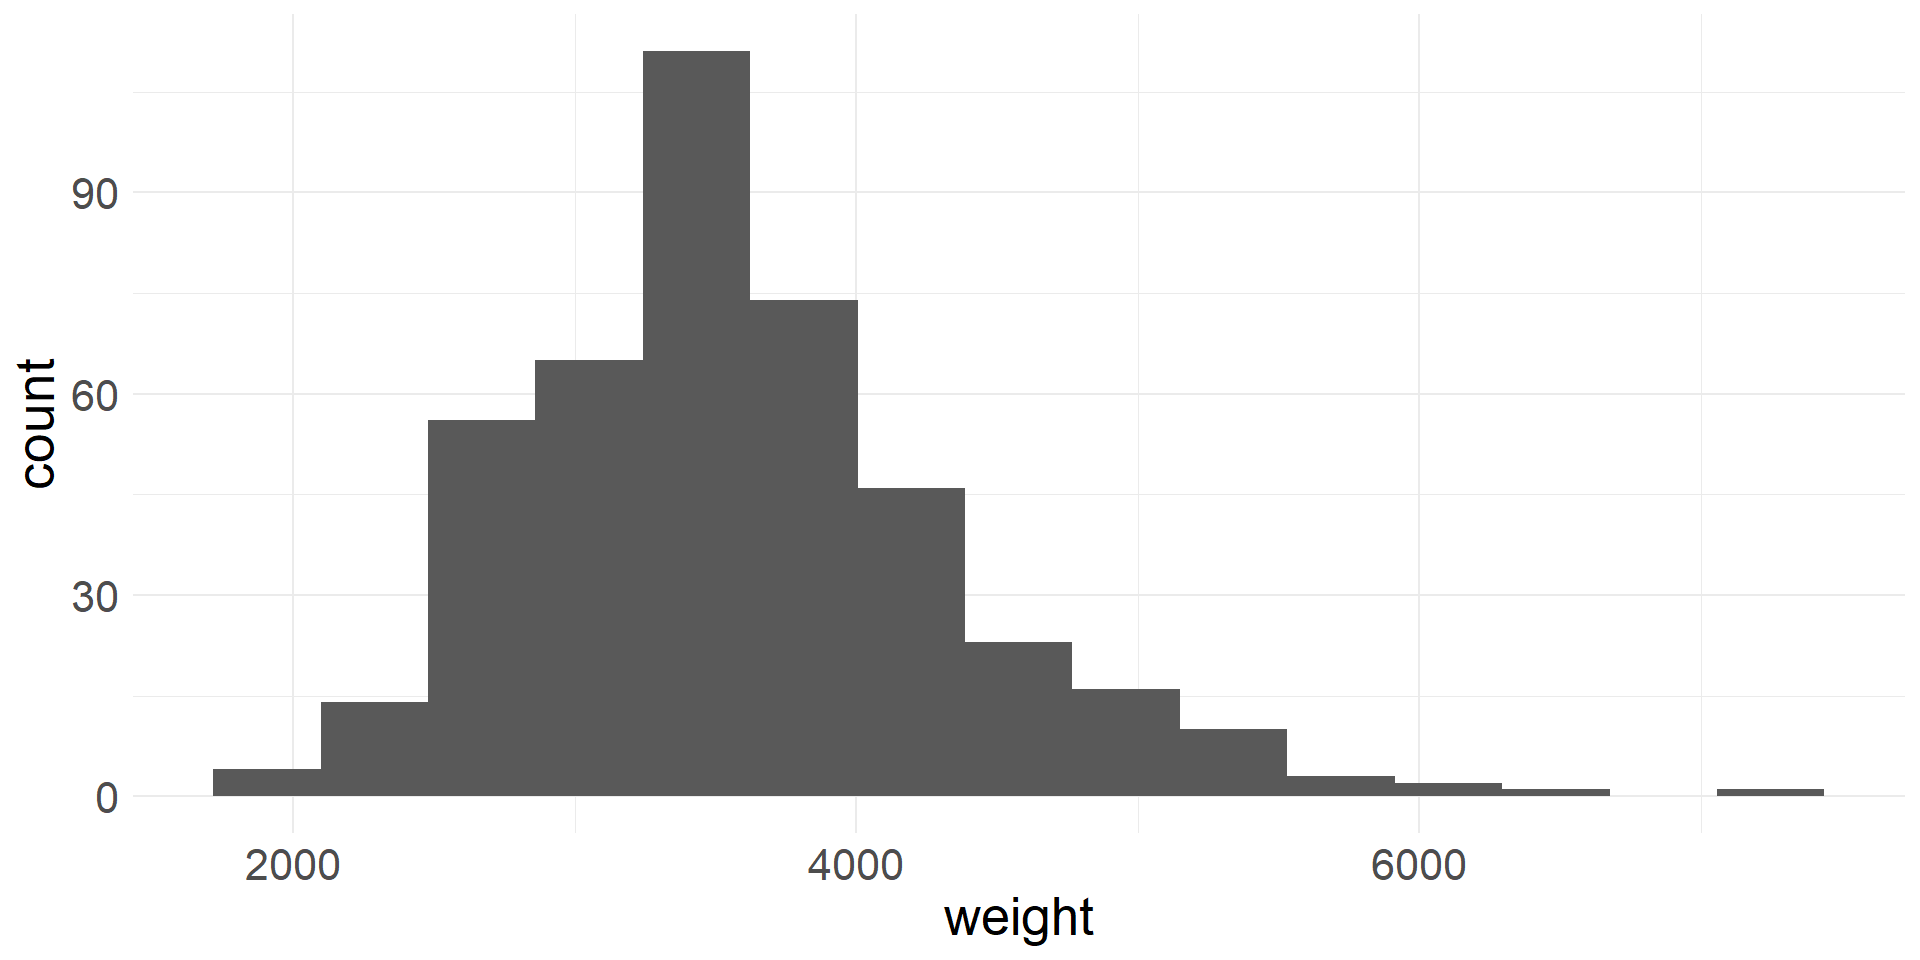
- Rather than using the defualt values, we can also specify the number of bins or the bin width
- Here we specify the number of bins
Density plot
- In a density plot the shape of the distribution is represented using a smooth line (think of this as a smoothed out histogram)
- Let’s create a density plot of vehicle weights
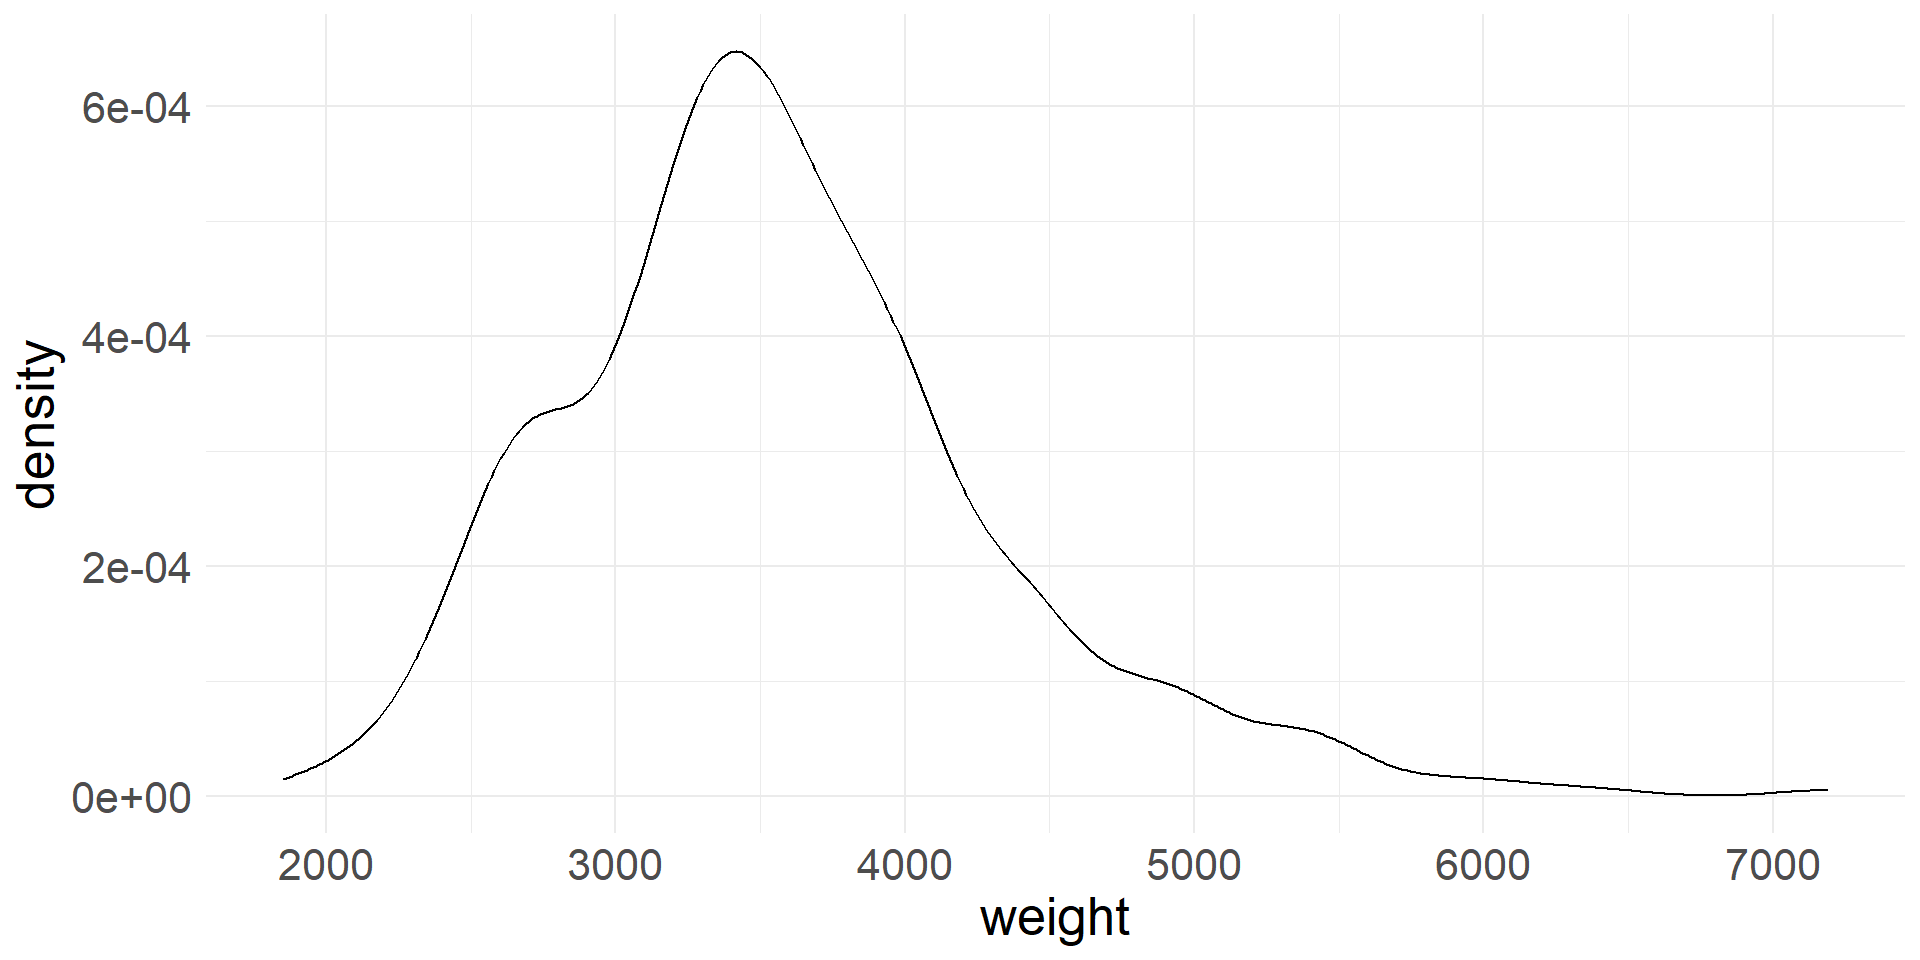
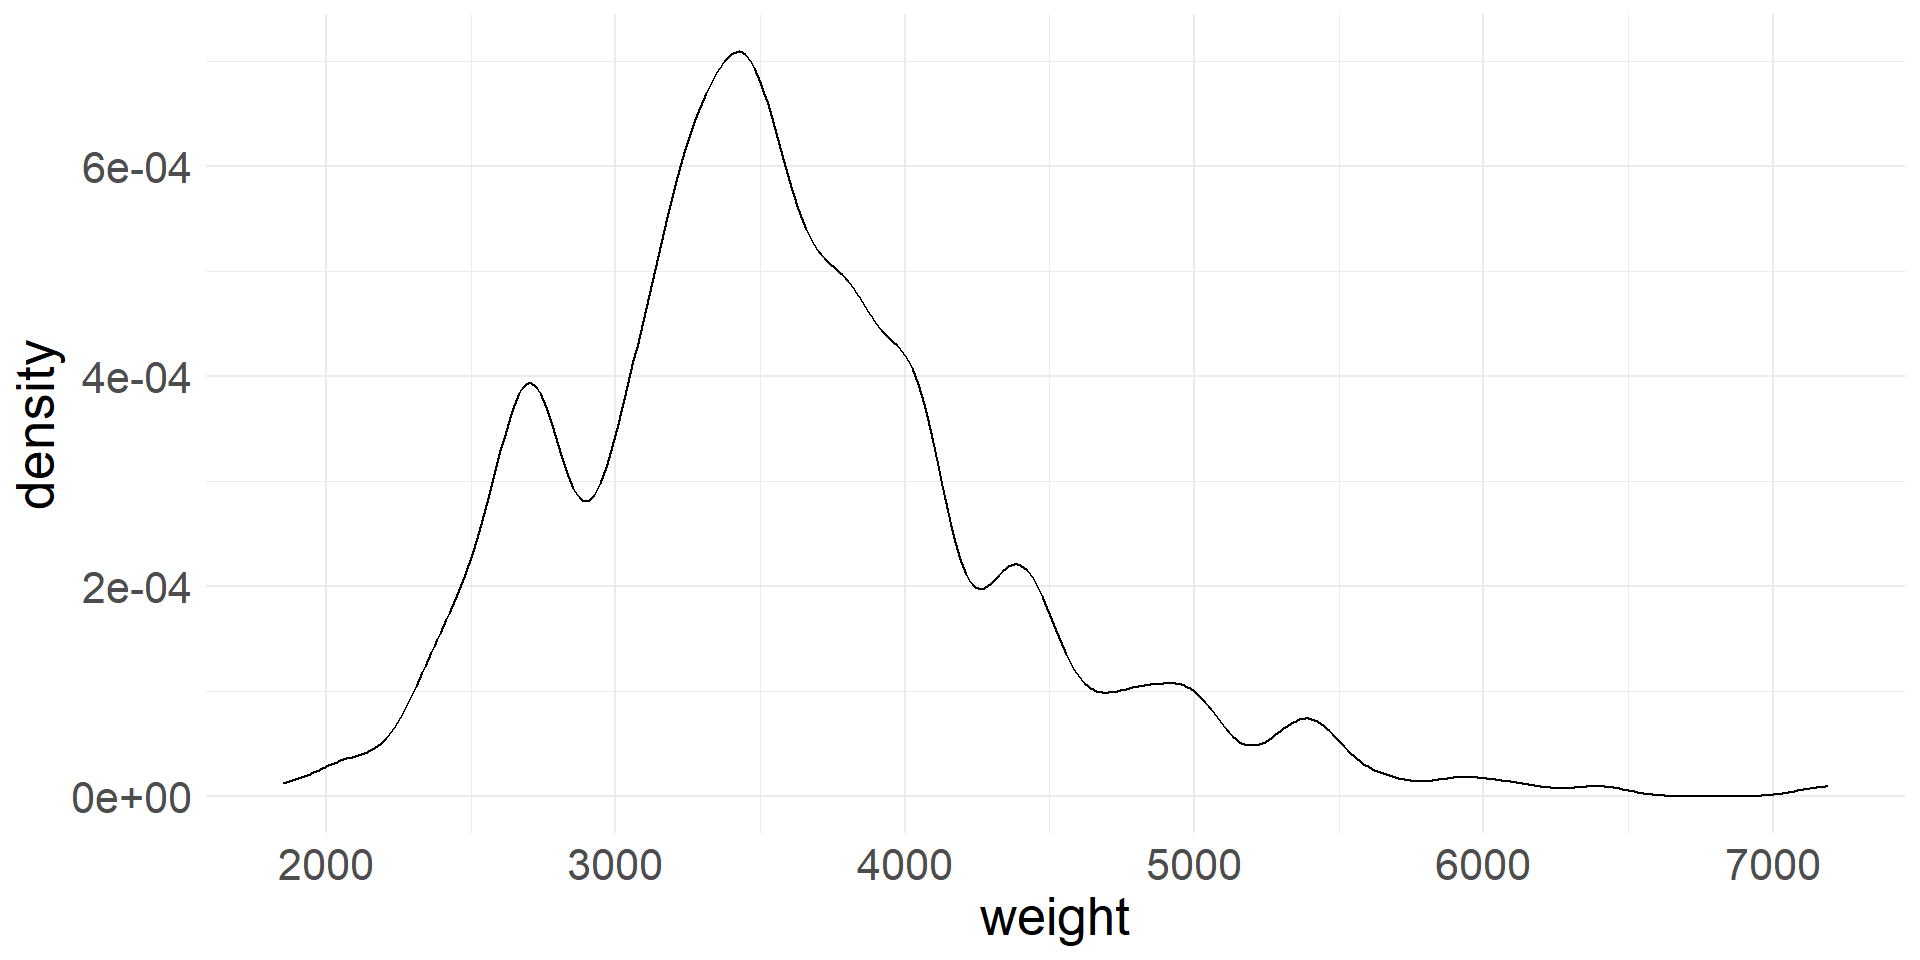
- The bandwidth controls the degree of smoothing and can be adjusted to emphasize different scales of variation in the data
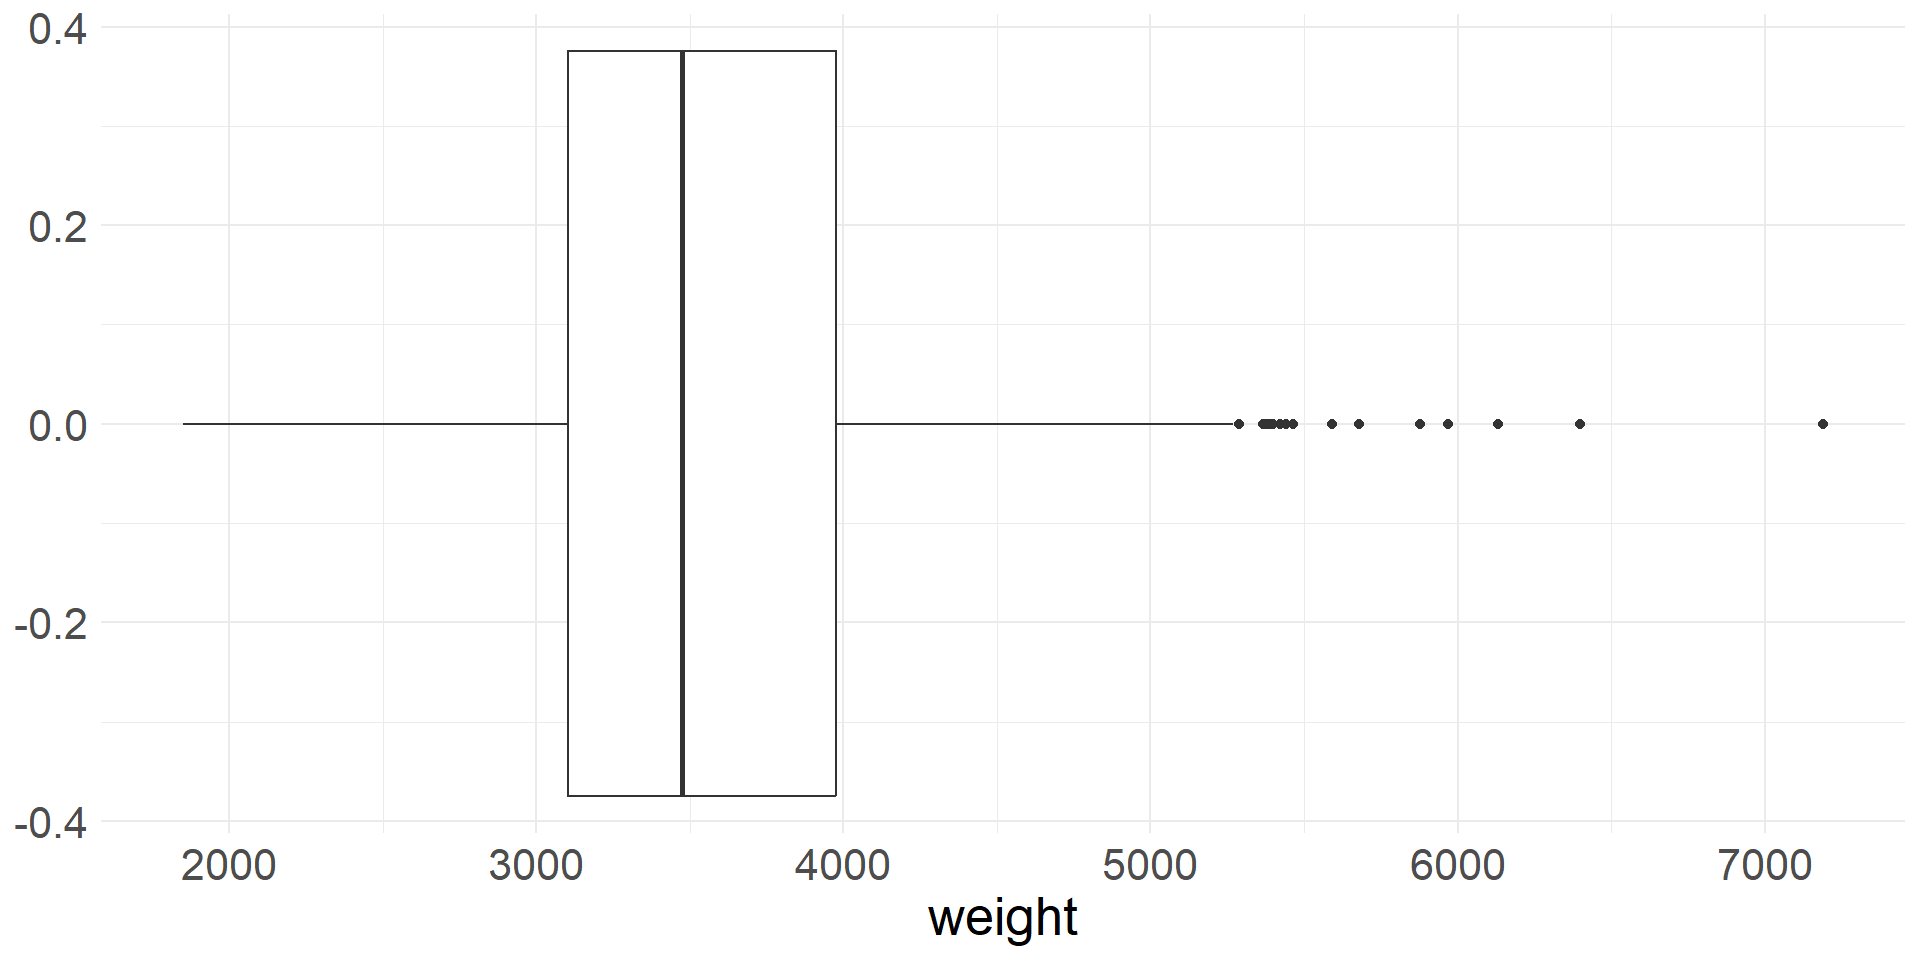
Box plot
A box plot takes a different approach to visualizing the distribution of a numerical variable
Boxplots are constructed using summary statistics:
- The box extends from Q1 to Q3 with a vertical line at the median (Q2)
- Whiskers extend from the box to the smallest and largest values that are not outliers
- Outliers are plotted as individual points
ggplotuses the \(1.5\times\)IQR rule to compute outliers- It is important to note that box plots can miss important characteristics of the distributions
- For example, if the distribution is bimodal, then the box plot won’t show it
- Let’s create a box plot of vehicle weights. Are there any outliers?
Scatter plot - visualizing 2 numerical variables
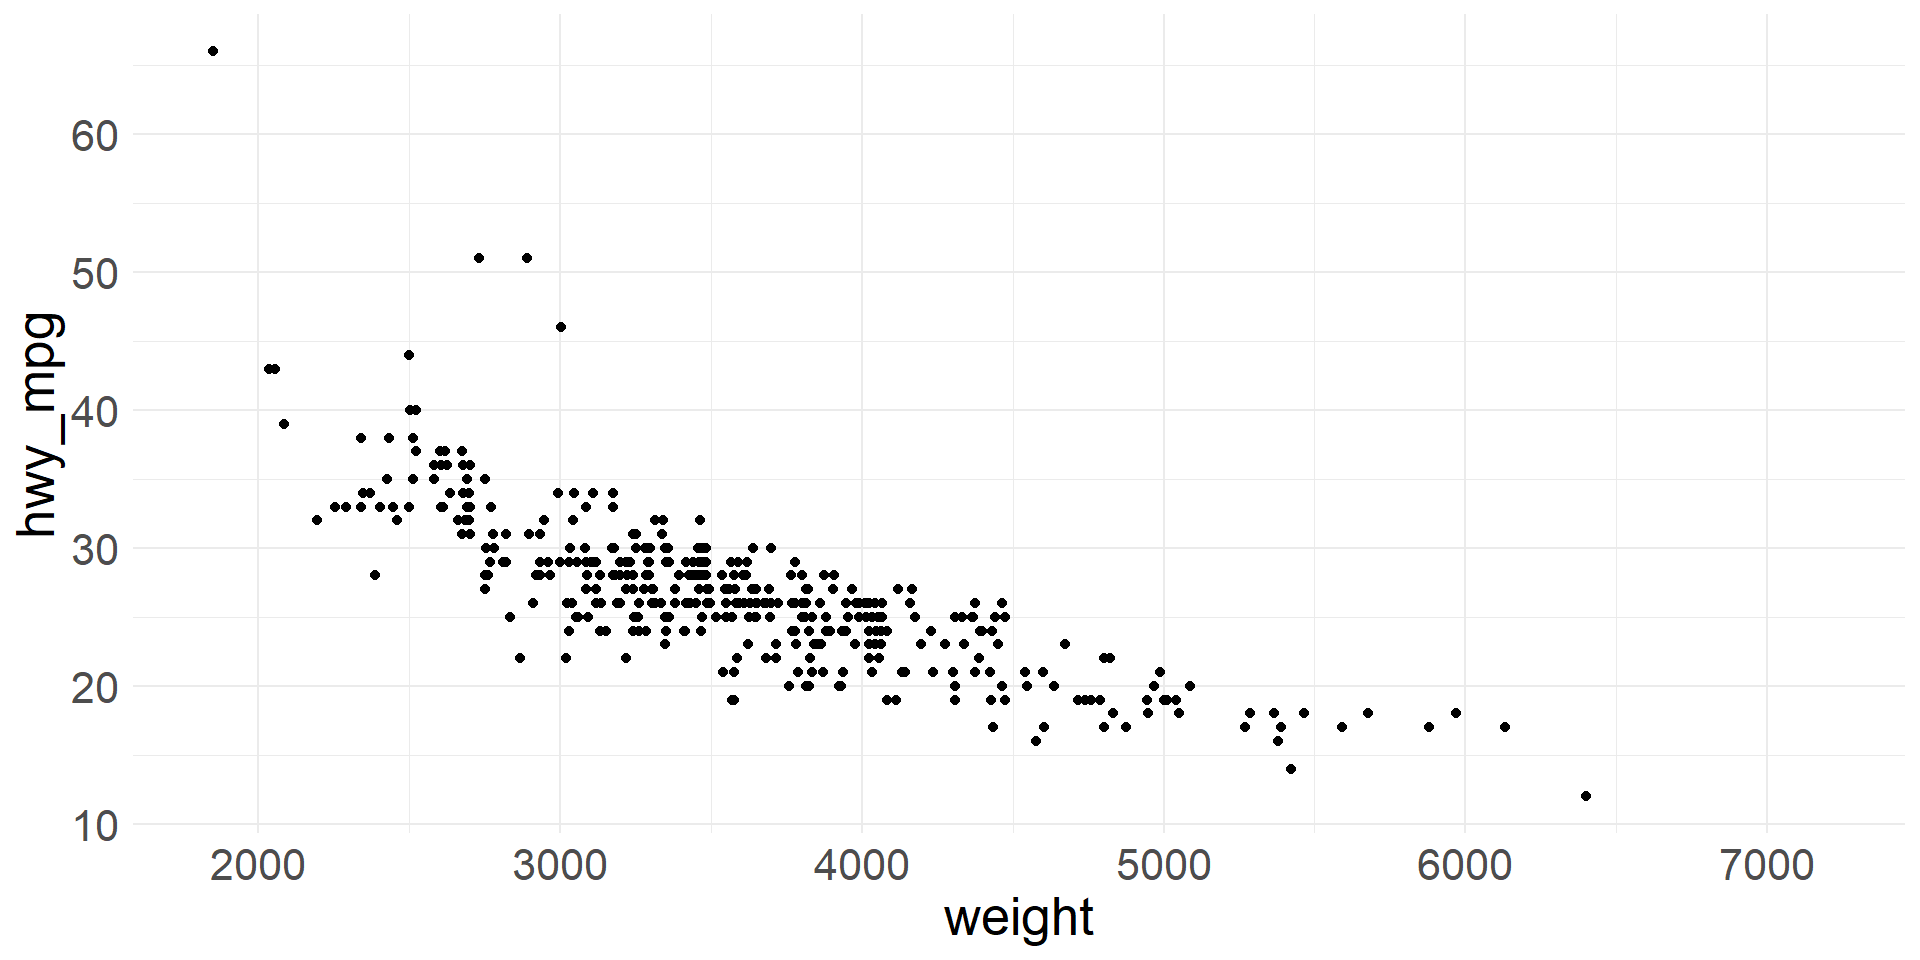
- We can visualize two numeric variables using a scatter plot
- Let’s plot highway gas mileage against vehicle weight
Faceted histograms
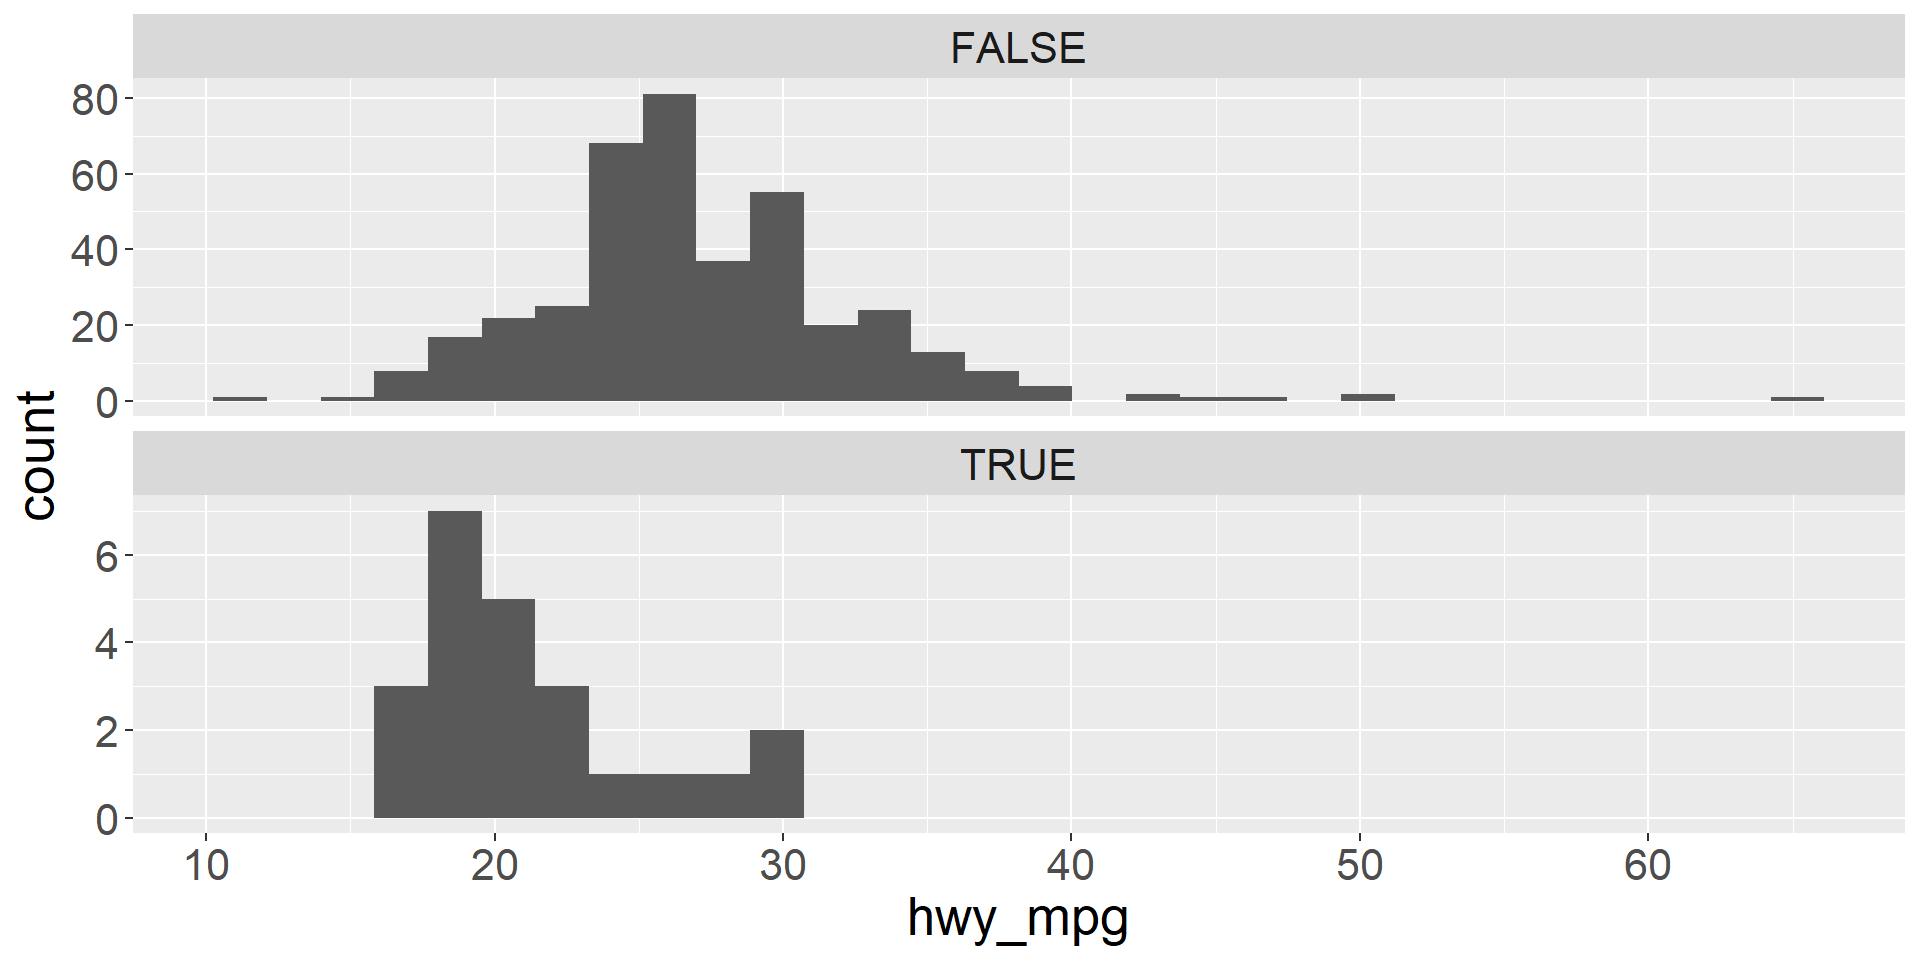
- We can visualize two variables, where one is numeric and the other is categorical using faceted histograms
- We simply plot a separate histogram for each level of the categorical variable
- Let’s use a faceted histogram to visualize the distribution of highway mileage for vehicles that are pickups and vehicles that are not pickups
Colored density plots
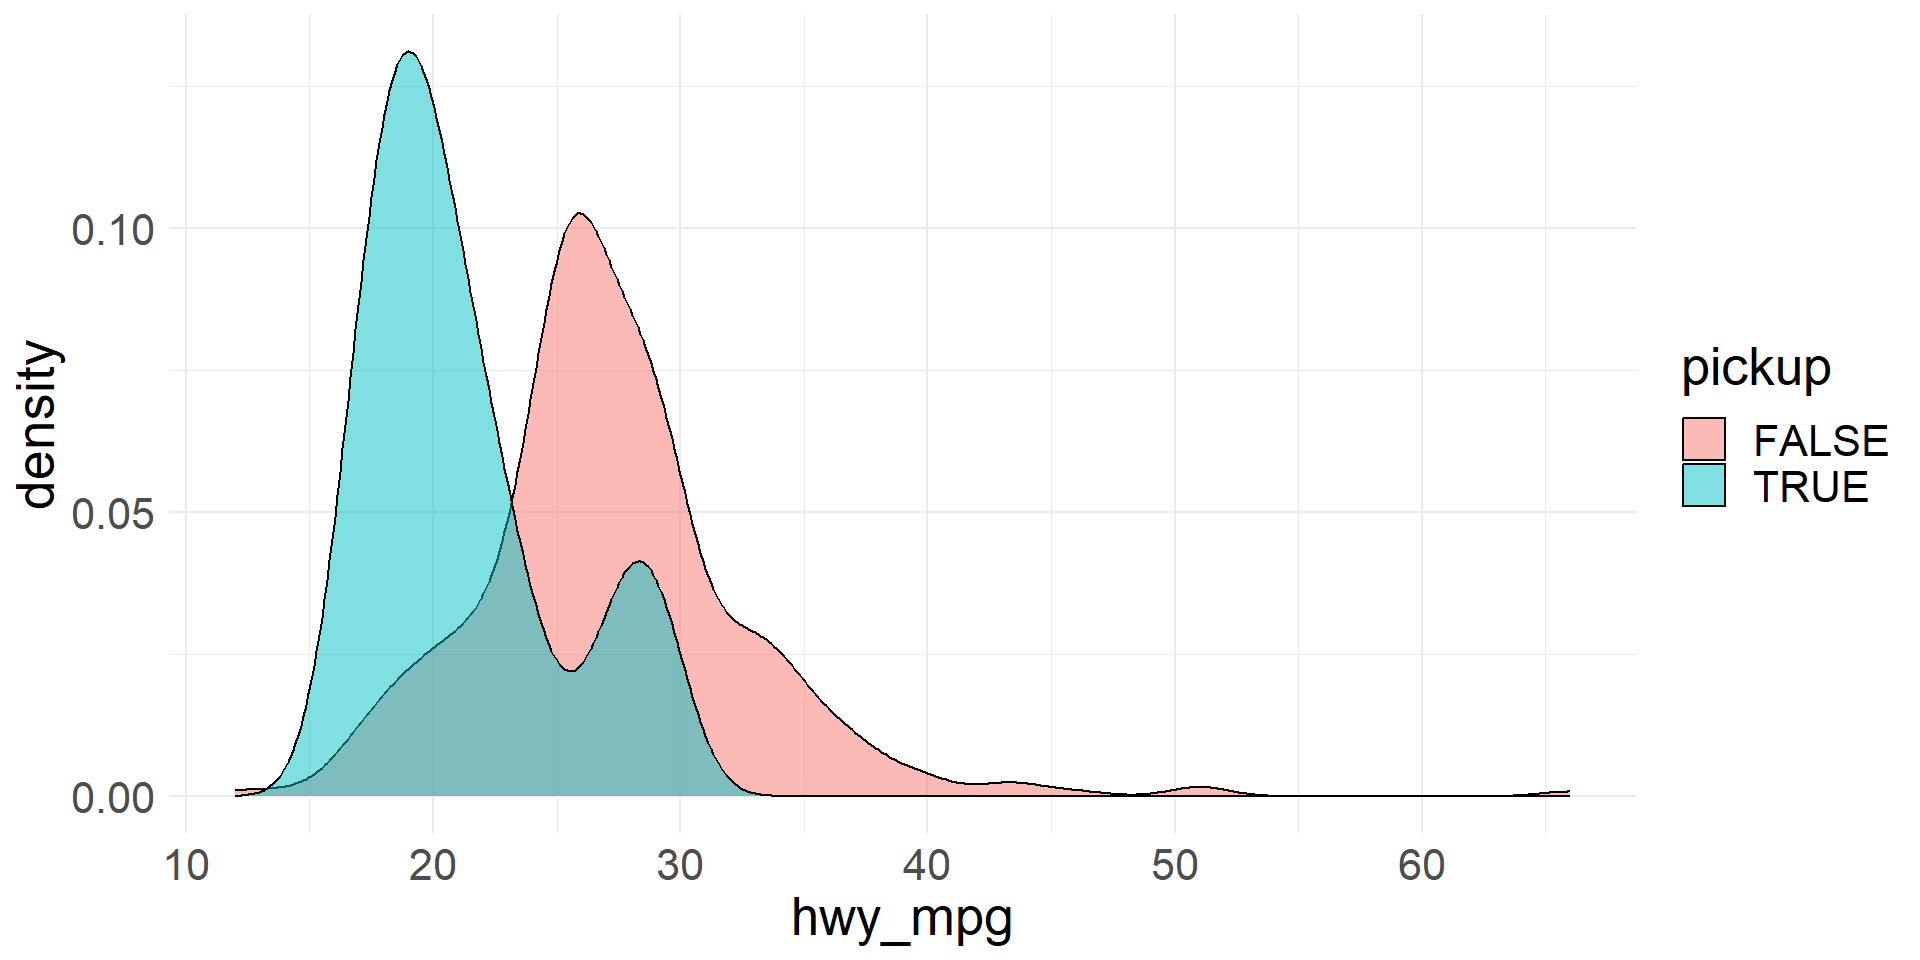
- We can use colored density plots for a similar purpose-
- By coloring the density plots according to the levels of the categorical variable, we can plot them on the same axes and still distinguish between the distributions
- Let’s use colored density plots to visualize the distribution of highway mileage for vehicles that are pickups and vehicles that are not pickups
- The level of
alphacontrols the transparency of the plots
Transforming data
- Sometimes it is helpful to transform a variable
- For example, a log transformation is commonly applied to distributions that are strongly skewed to the right
- The transformed variable is often more appropriate for analyses that use a mathematical model to approximate the distribution of the data
- The
msrpdata is skewed right
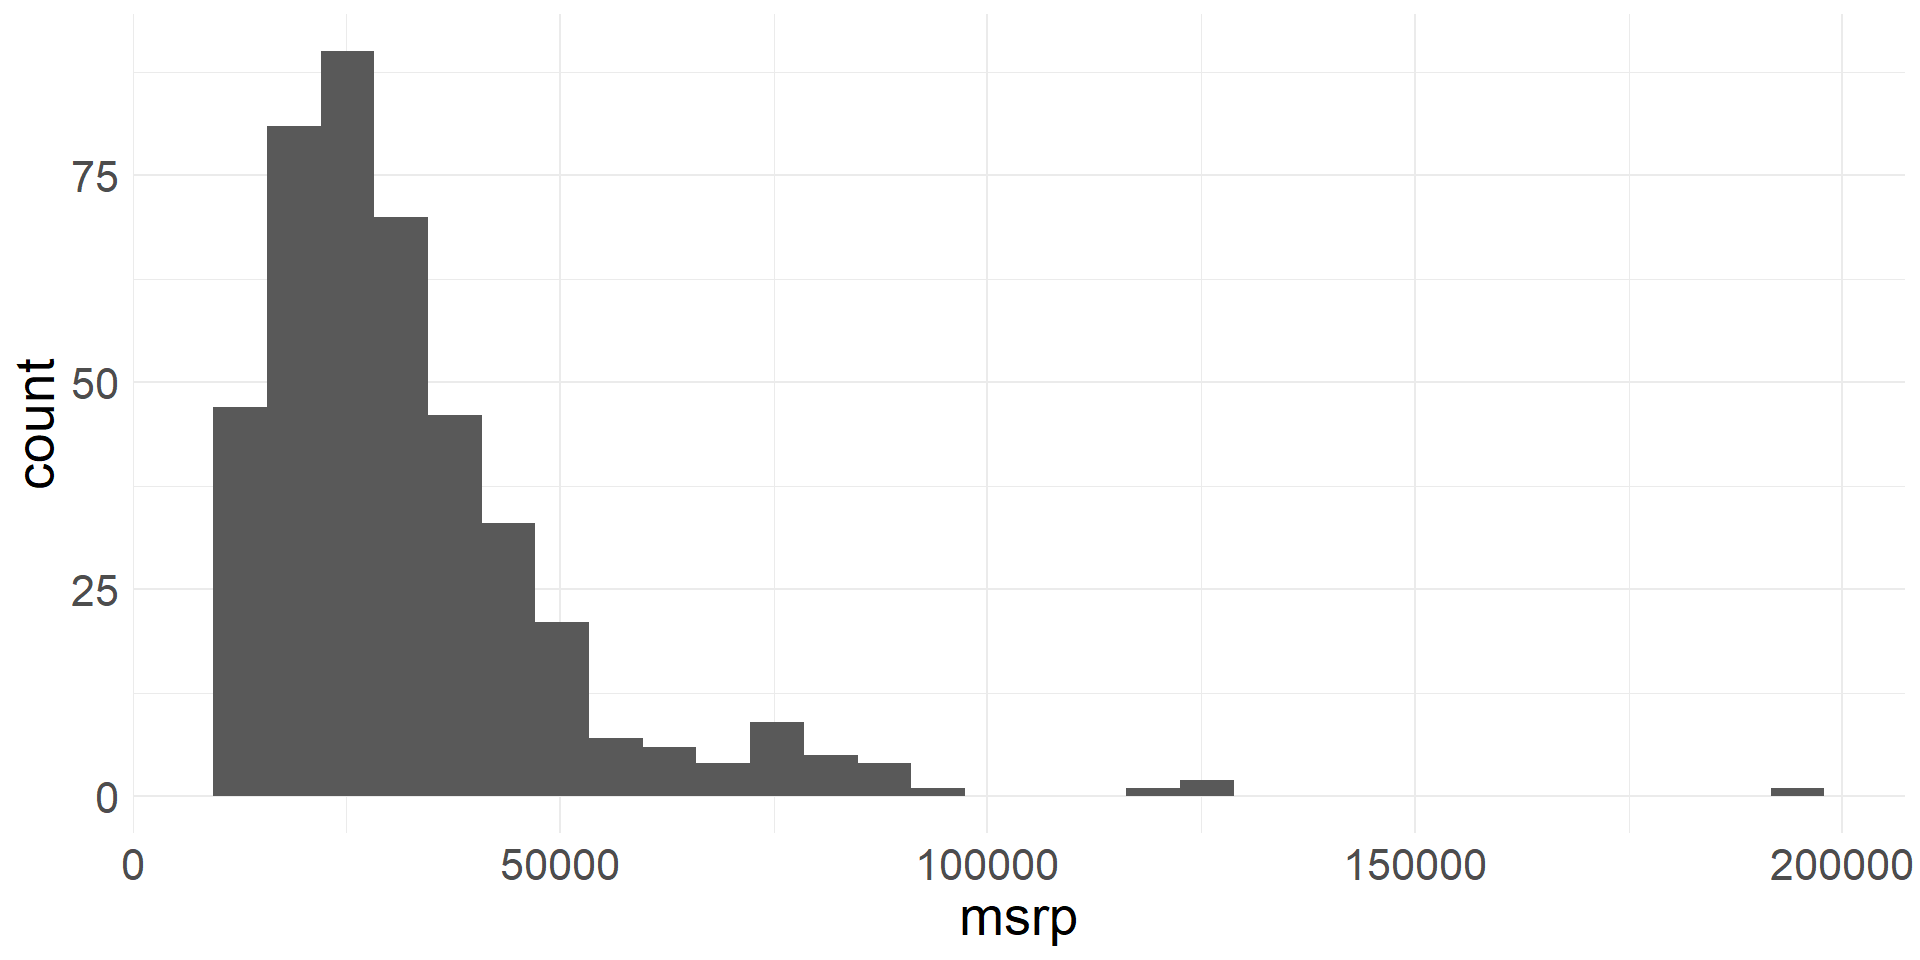
- Let’s create a new variable by taking the (natural) log of the
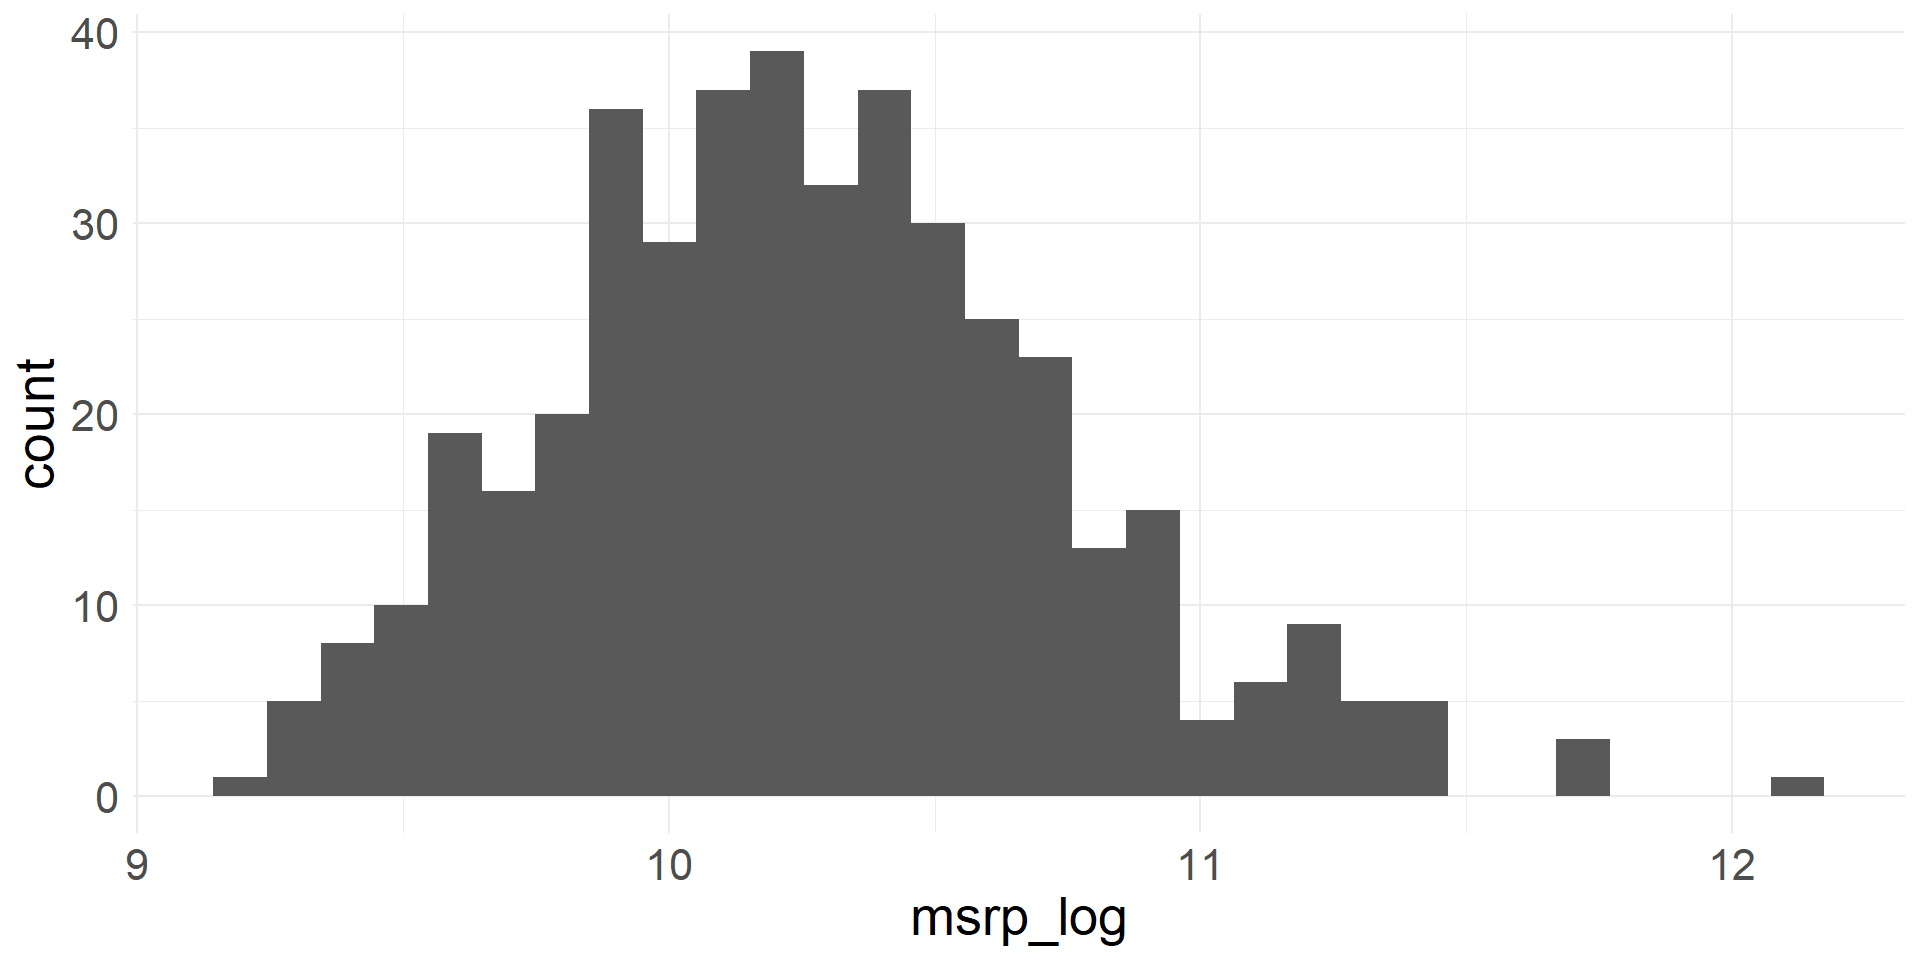
msrpvariable - The transformed variable has a more symmetric, bell-shaped distribution