rm(list = ls())
gc()
used (Mb) gc trigger (Mb) max used (Mb)
Ncells 617881 33.0 1411252 75.4 872449 46.6
Vcells 1127138 8.6 8388608 64.0 1932343 14.8library(tidyverse)
library(tidymodels)
library(ISLR2)rm(list = ls())
gc() used (Mb) gc trigger (Mb) max used (Mb)
Ncells 617881 33.0 1411252 75.4 872449 46.6
Vcells 1127138 8.6 8388608 64.0 1932343 14.8library(tidyverse)
library(tidymodels)
library(ISLR2)This lab explores linear model selection and regularization using the Hitters data. We will predict baseball player Salary using ridge regression, the lasso, principal components regression (PCR), and partial least squares (PLS).
The code patterns in the worked examples are intended to serve as templates for the questions. Most questions ask you to make a modest change to code that has just been demonstrated and then use more than one output to support your conclusion.
The Hitters data contain several characteristics of professional baseball players. Because Salary is the response, observations with missing salary values must be removed before fitting models.
Hitters <- Hitters |>
  as_tibble() |>
  filter(!is.na(Salary))

Hitters |> glimpse()
Rows: 263
Columns: 20
$ AtBat <int> 315, 479, 496, 321, 594, 185, 298, 323, 401, 574, 202, 418, …
$ Hits <int> 81, 130, 141, 87, 169, 37, 73, 81, 92, 159, 53, 113, 60, 43,…
$ HmRun <int> 7, 18, 20, 10, 4, 1, 0, 6, 17, 21, 4, 13, 0, 7, 20, 2, 8, 16…
$ Runs <int> 24, 66, 65, 39, 74, 23, 24, 26, 49, 107, 31, 48, 30, 29, 89,…
$ RBI <int> 38, 72, 78, 42, 51, 8, 24, 32, 66, 75, 26, 61, 11, 27, 75, 8…
$ Walks <int> 39, 76, 37, 30, 35, 21, 7, 8, 65, 59, 27, 47, 22, 30, 73, 15…
$ Years <int> 14, 3, 11, 2, 11, 2, 3, 2, 13, 10, 9, 4, 6, 13, 15, 5, 8, 1,…
$ CAtBat <int> 3449, 1624, 5628, 396, 4408, 214, 509, 341, 5206, 4631, 1876…
$ CHits <int> 835, 457, 1575, 101, 1133, 42, 108, 86, 1332, 1300, 467, 392…
$ CHmRun <int> 69, 63, 225, 12, 19, 1, 0, 6, 253, 90, 15, 41, 4, 36, 177, 5…
$ CRuns <int> 321, 224, 828, 48, 501, 30, 41, 32, 784, 702, 192, 205, 309,…
$ CRBI <int> 414, 266, 838, 46, 336, 9, 37, 34, 890, 504, 186, 204, 103, …
$ CWalks <int> 375, 263, 354, 33, 194, 24, 12, 8, 866, 488, 161, 203, 207, …
$ League <fct> N, A, N, N, A, N, A, N, A, A, N, N, A, N, N, A, N, N, A, N, …
$ Division <fct> W, W, E, E, W, E, W, W, E, E, W, E, E, E, W, W, W, E, W, W, …
$ PutOuts <int> 632, 880, 200, 805, 282, 76, 121, 143, 0, 238, 304, 211, 121…
$ Assists <int> 43, 82, 11, 40, 421, 127, 283, 290, 0, 445, 45, 11, 151, 45,…
$ Errors <int> 10, 14, 3, 4, 25, 7, 9, 19, 0, 22, 11, 7, 6, 8, 10, 16, 2, 5…
$ Salary <dbl> 475.000, 480.000, 500.000, 91.500, 750.000, 70.000, 100.000,…
$ NewLeague <fct> N, A, N, N, A, A, A, N, A, A, N, N, A, N, N, A, N, N, N, N, …Best subset selection and forward/backward stepwise selection are not currently implemented directly in the tidymodels framework used in this lab. We will focus instead on regularization and dimension-reduction approaches that work naturally with recipes, workflows, and tuning.
Ridge regression uses an \(L_2\) penalty. In parsnip, use linear_reg() with the glmnet engine and set mixture = 0.
We begin with a fixed penalty of 0.
ridge_spec_fixed <- linear_reg(mixture = 0, penalty = 0) |>
  set_mode("regression") |>
  set_engine("glmnet")

ridge_fit_fixed <- ridge_spec_fixed |>
  fit(Salary ~ ., data = Hitters)
View the fitted coefficients for the specified penalty.
ridge_fit_fixed |> tidy()# A tibble: 20 × 3
term estimate penalty
<chr> <dbl> <dbl>
1 (Intercept) 81.1 0
2 AtBat -0.682 0
3 Hits 2.77 0
4 HmRun -1.37 0
5 Runs 1.01 0
6 RBI 0.713 0
7 Walks 3.38 0
8 Years -9.07 0
9 CAtBat -0.00120 0
10 CHits 0.136 0
11 CHmRun 0.698 0
12 CRuns 0.296 0
13 CRBI 0.257 0
14 CWalks -0.279 0
15 LeagueN 53.2 0
16 DivisionW -123. 0
17 PutOuts 0.264 0
18 Assists 0.170 0
19 Errors -3.69 0
20 NewLeagueN -18.1 0glmnet fits a sequence of penalty values internally, so we can inspect the coefficient estimates at other penalty values without refitting the model.
ridge_fit_fixed |> tidy(penalty = 11498)# A tibble: 20 × 3
term estimate penalty
<chr> <dbl> <dbl>
1 (Intercept) 407. 11498
2 AtBat 0.0370 11498
3 Hits 0.138 11498
4 HmRun 0.525 11498
5 Runs 0.231 11498
6 RBI 0.240 11498
7 Walks 0.290 11498
8 Years 1.11 11498
9 CAtBat 0.00314 11498
10 CHits 0.0117 11498
11 CHmRun 0.0876 11498
12 CRuns 0.0234 11498
13 CRBI 0.0242 11498
14 CWalks 0.0250 11498
15 LeagueN 0.0866 11498
16 DivisionW -6.23 11498
17 PutOuts 0.0165 11498
18 Assists 0.00262 11498
19 Errors -0.0206 11498
20 NewLeagueN 0.303 11498ridge_fit_fixed |> tidy(penalty = 705)# A tibble: 20 × 3
term estimate penalty
<chr> <dbl> <dbl>
1 (Intercept) 54.4 705
2 AtBat 0.112 705
3 Hits 0.656 705
4 HmRun 1.18 705
5 Runs 0.937 705
6 RBI 0.847 705
7 Walks 1.32 705
8 Years 2.58 705
9 CAtBat 0.0108 705
10 CHits 0.0468 705
11 CHmRun 0.338 705
12 CRuns 0.0937 705
13 CRBI 0.0979 705
14 CWalks 0.0718 705
15 LeagueN 13.7 705
16 DivisionW -54.7 705
17 PutOuts 0.119 705
18 Assists 0.0161 705
19 Errors -0.704 705
20 NewLeagueN 8.61 705ridge_fit_fixed |> tidy(penalty = 50)# A tibble: 20 × 3
term estimate penalty
<chr> <dbl> <dbl>
1 (Intercept) 48.2 50
2 AtBat -0.354 50
3 Hits 1.95 50
4 HmRun -1.29 50
5 Runs 1.16 50
6 RBI 0.809 50
7 Walks 2.71 50
8 Years -6.20 50
9 CAtBat 0.00609 50
10 CHits 0.107 50
11 CHmRun 0.629 50
12 CRuns 0.217 50
13 CRBI 0.215 50
14 CWalks -0.149 50
15 LeagueN 45.9 50
16 DivisionW -118. 50
17 PutOuts 0.250 50
18 Assists 0.121 50
19 Errors -3.28 50
20 NewLeagueN -9.42 50As the penalty increases, the ridge coefficients are pulled toward zero.
ridge_fit_fixed |>
  autoplot() +
  theme_minimal()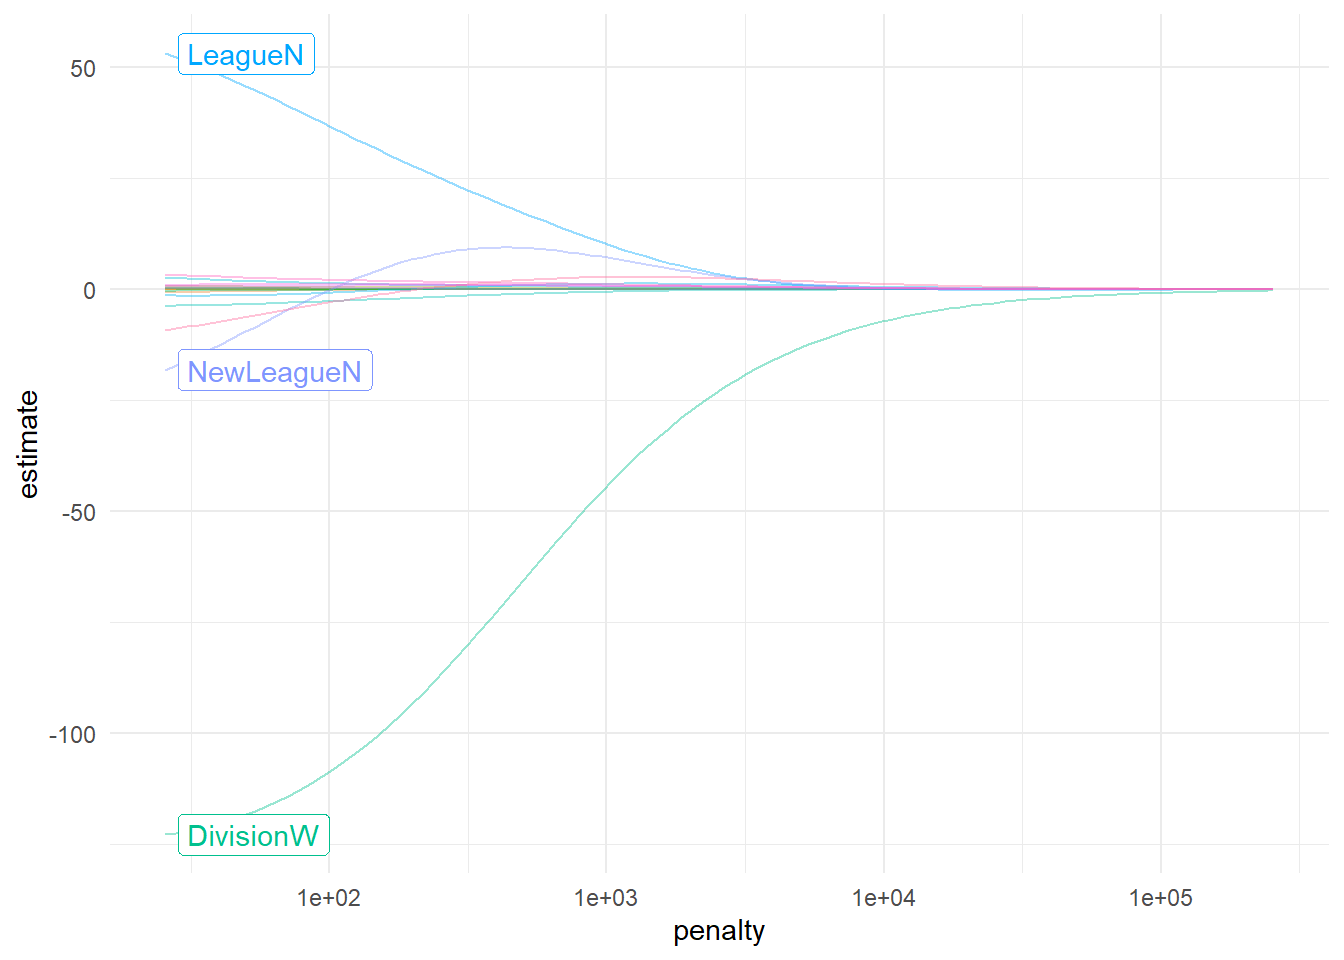
Predictions can also be requested at a particular penalty value.
ridge_fit_fixed |>
  predict(new_data = Hitters, penalty = 500)
# A tibble: 263 × 1
.pred
<dbl>
1 525.
2 620.
3 895.
4 425.
5 589.
6 179.
7 147.
8 187.
9 841.
10 840.
# ℹ 253 more rowsChoose two positive penalty values that are different from the values used above. For each penalty, display the ridge coefficient estimates. Also use the coefficient-path plot above as part of your answer.
Use the two coefficient tables and the plot to answer:
Helpful output: Reuse tidy(ridge_fit_fixed, penalty = ...) for two new values. The existing autoplot() is the complementary graphical evidence. You do not need to fit a new model.
A fixed penalty is arbitrary. We use cross-validation to choose the penalty based on predictive performance.
First split the data into training and testing sets, then create 10 folds from the training data.
set.seed(8675309)

Hitters_split <- Hitters |>
  initial_split(strata = Salary)

Hitters_train <- training(Hitters_split)
Hitters_test <- testing(Hitters_split)

Hitters_fold <- Hitters_train |>
  vfold_cv(v = 10)
Ridge regression is scale-sensitive, so normalize the predictors. step_novel() protects against new factor levels, step_dummy() creates indicator variables, and step_zv() removes predictors with zero variance.
ridge_recipe <- recipe(Salary ~ ., data = Hitters_train) |>
  step_novel(all_nominal_predictors()) |>
  step_dummy(all_nominal_predictors()) |>
  step_zv(all_predictors()) |>
  step_normalize(all_predictors())
Mark the penalty as a tuning parameter.
ridge_spec <- linear_reg(penalty = tune(), mixture = 0) |>
  set_mode("regression") |>
  set_engine("glmnet")

ridge_wf <- workflow() |>
  add_recipe(ridge_recipe) |>
  add_model(ridge_spec)
Create a log-scaled grid of penalty values and tune across the 10 folds.
ridge_penalty_grid <- grid_regular(
  penalty(range = c(-5, 5)),
  levels = 50
)

set.seed(8675309)
ridge_tune_res <- ridge_wf |>
  tune_grid(
    resamples = Hitters_fold,
    grid = ridge_penalty_grid
  )
Examine the tuning plot and metrics.
ridge_tune_res |>
  autoplot() +
  theme_minimal()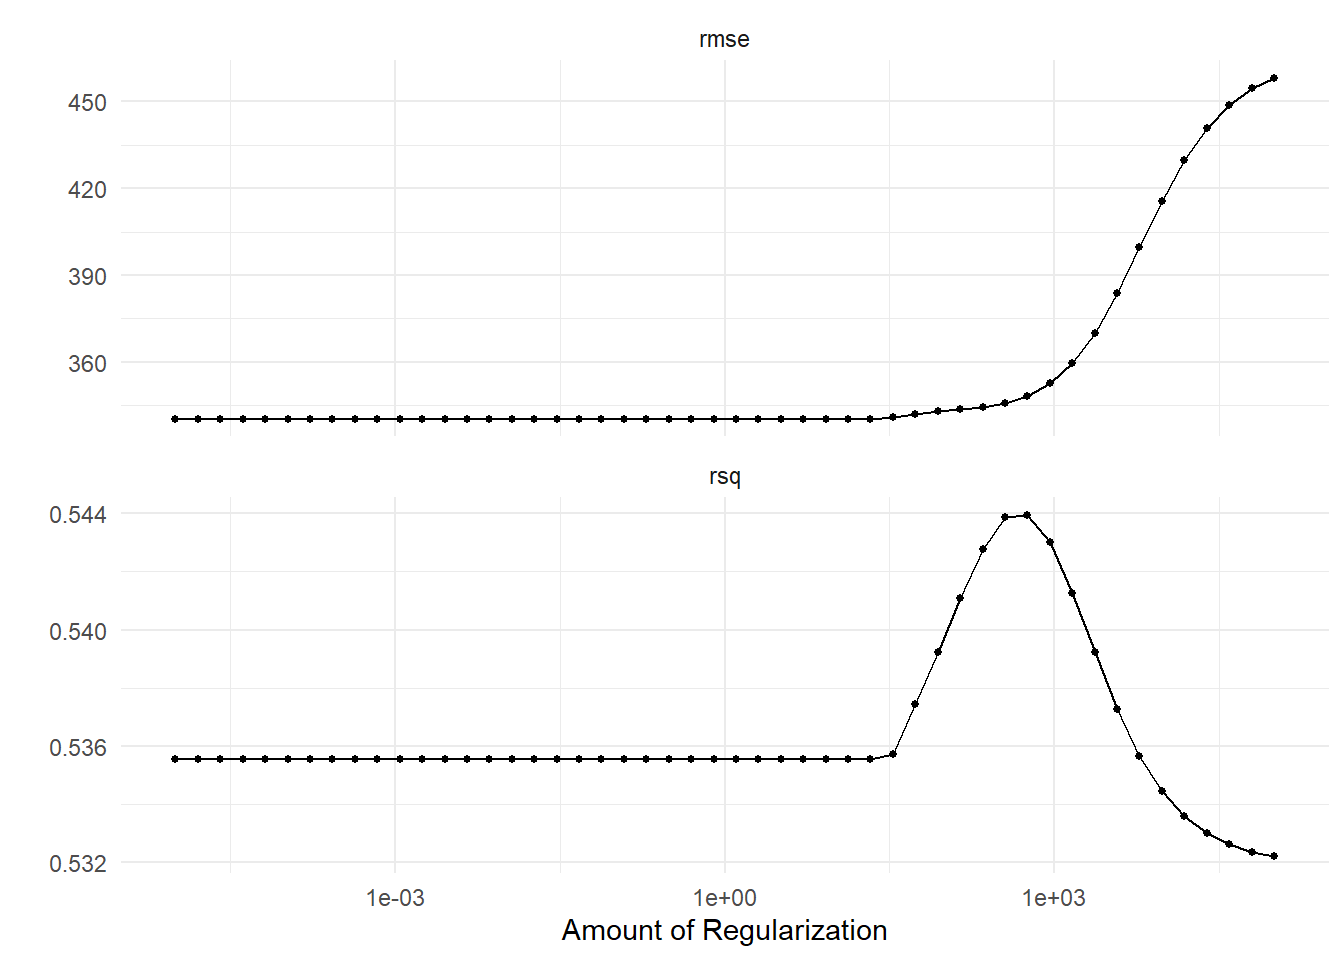
ridge_tune_res |>
  collect_metrics()
# A tibble: 100 × 7
penalty .metric .estimator mean n std_err .config
<dbl> <chr> <chr> <dbl> <int> <dbl> <chr>
1 0.00001 rmse standard 340. 10 39.4 pre0_mod01_post0
2 0.00001 rsq standard 0.536 10 0.0692 pre0_mod01_post0
3 0.0000160 rmse standard 340. 10 39.4 pre0_mod02_post0
4 0.0000160 rsq standard 0.536 10 0.0692 pre0_mod02_post0
5 0.0000256 rmse standard 340. 10 39.4 pre0_mod03_post0
6 0.0000256 rsq standard 0.536 10 0.0692 pre0_mod03_post0
7 0.0000409 rmse standard 340. 10 39.4 pre0_mod04_post0
8 0.0000409 rsq standard 0.536 10 0.0692 pre0_mod04_post0
9 0.0000655 rmse standard 340. 10 39.4 pre0_mod05_post0
10 0.0000655 rsq standard 0.536 10 0.0692 pre0_mod05_post0
# ℹ 90 more rowsChoose the penalty that gives the best \(R^2\) estimate, finalize the workflow, fit it to all training data, and evaluate it on the test data.
ridge_best_penalty <- ridge_tune_res |>
  select_best(metric = "rsq")

ridge_best_penalty
# A tibble: 1 × 2
penalty .config
<dbl> <chr>
1 569. pre0_mod39_post0ridge_final_wf <- ridge_wf |>
finalize_workflow(ridge_best_penalty)
ridge_final_fit <- ridge_final_wf |>
fit(data = Hitters_train)
ridge_test_pred <- ridge_final_fit |>
augment(new_data = Hitters_test)
ridge_test_pred |>
rmse(truth = Salary, estimate = .pred)# A tibble: 1 × 3
.metric .estimator .estimate
<chr> <chr> <dbl>
1 rmse standard 278.ridge_test_pred |>
rsq(truth = Salary, estimate = .pred)# A tibble: 1 × 3
.metric .estimator .estimate
<chr> <chr> <dbl>
1 rsq standard 0.473The worked example selects the ridge penalty using cross-validated \(R^2\). Now select the best ridge penalty using RMSE instead.
Compare the select_best(metric = "rmse") result with the existing ridge_best_penalty selected by \(R^2\). Then fit the RMSE-selected final model and evaluate it on Hitters_test.
Answer:
Helpful output: Reuse select_best(), finalize_workflow(), fit(), augment(), rmse(), and rsq() exactly as shown above. Only the selection metric changes.
The lasso uses an \(L_1\) penalty. In parsnip, use mixture = 1. Unlike ridge regression, the lasso can shrink some coefficients exactly to zero.
The preprocessing steps are the same as for ridge.
lasso_recipe <- recipe(Salary ~ ., data = Hitters_train) |>
  step_novel(all_nominal_predictors()) |>
  step_dummy(all_nominal_predictors()) |>
  step_zv(all_predictors()) |>
  step_normalize(all_predictors())

lasso_spec <- linear_reg(penalty = tune(), mixture = 1) |>
  set_mode("regression") |>
  set_engine("glmnet")

lasso_wf <- workflow() |>
  add_recipe(lasso_recipe) |>
  add_model(lasso_spec)
Tune a grid of lasso penalties.
lasso_penalty_grid <- grid_regular(
  penalty(range = c(-2, 2)),
  levels = 50
)

set.seed(8675309)
lasso_tune_res <- lasso_wf |>
  tune_grid(
    resamples = Hitters_fold,
    grid = lasso_penalty_grid
  )
Inspect the results.
lasso_tune_res |>
  autoplot() +
  theme_minimal()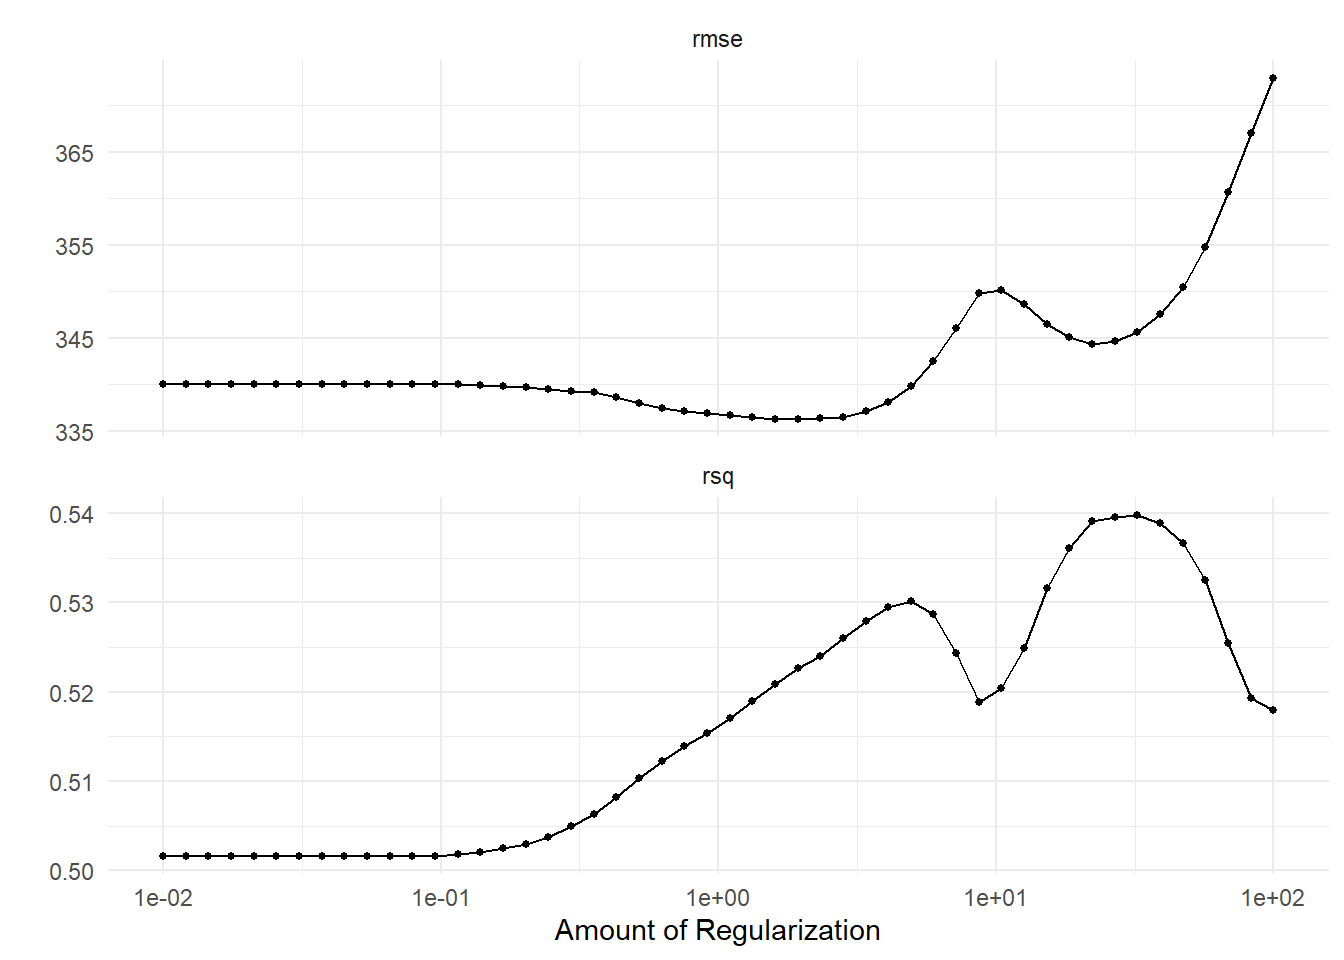
lasso_tune_res |>
  show_best(metric = "rsq")
# A tibble: 5 × 7
penalty .metric .estimator mean n std_err .config
<dbl> <chr> <chr> <dbl> <int> <dbl> <chr>
1 32.4 rsq standard 0.540 10 0.0647 pre0_mod44_post0
2 26.8 rsq standard 0.540 10 0.0643 pre0_mod43_post0
3 22.2 rsq standard 0.539 10 0.0640 pre0_mod42_post0
4 39.1 rsq standard 0.539 10 0.0647 pre0_mod45_post0
5 47.1 rsq standard 0.537 10 0.0646 pre0_mod46_post0Select the best penalty, fit the final model, and evaluate it on the test set.
lasso_best_penalty <- lasso_tune_res |>
  select_best(metric = "rsq")

lasso_final_wf <- lasso_wf |>
  finalize_workflow(lasso_best_penalty)

lasso_final_fit <- lasso_final_wf |>
  fit(data = Hitters_train)

lasso_test_pred <- lasso_final_fit |>
  augment(new_data = Hitters_test)

lasso_test_pred |>
  rmse(truth = Salary, estimate = .pred)
# A tibble: 1 × 3
.metric .estimator .estimate
<chr> <chr> <dbl>
1 rmse standard 281.lasso_test_pred |>
rsq(truth = Salary, estimate = .pred)# A tibble: 1 × 3
.metric .estimator .estimate
<chr> <chr> <dbl>
1 rsq standard 0.463The final coefficient table lets us see which predictors were retained.
lasso_final_fit |> tidy()# A tibble: 20 × 3
term estimate penalty
<chr> <dbl> <dbl>
1 (Intercept) 552. 32.4
2 AtBat 0 32.4
3 Hits 109. 32.4
4 HmRun 0 32.4
5 Runs 0 32.4
6 RBI 0 32.4
7 Walks 28.8 32.4
8 Years 0 32.4
9 CAtBat 0 32.4
10 CHits 0 32.4
11 CHmRun 0 32.4
12 CRuns 32.0 32.4
13 CRBI 173. 32.4
14 CWalks 0 32.4
15 PutOuts 34.7 32.4
16 Assists 0 32.4
17 Errors 0 32.4
18 League_N 0 32.4
19 Division_W -49.3 32.4
20 NewLeague_N 0 32.4Use the fitted lasso model above to determine how many non-intercept coefficients are nonzero. Then compare its test performance with the final ridge model.
Answer:
Helpful output: Start from lasso_final_fit |> tidy(). Filter out (Intercept) and coefficients equal to zero. For prediction performance, reuse the rmse() and rsq() output already demonstrated.
The current lasso grid covers penalties from \(10^{-2}\) through \(10^2\). Create a narrower grid covering penalties from \(10^{-1}\) through \(10^2\), again using 50 levels, and rerun the lasso tuning analysis.
Use the new tuning plot and show_best() output to answer:
Helpful output: Modify only penalty(range = ...), then reuse tune_grid(), autoplot(), select_best(), finalize_workflow(), and the test RMSE code.
PCR uses principal components as predictors in a linear regression model. In tidymodels, PCA is performed in the recipe.
lm_spec <- linear_reg() |>
  set_mode("regression") |>
  set_engine("lm")

pca_recipe <- recipe(Salary ~ ., data = Hitters_train) |>
  step_novel(all_nominal_predictors()) |>
  step_dummy(all_nominal_predictors()) |>
  step_zv(all_predictors()) |>
  step_normalize(all_predictors()) |>
  step_pca(all_predictors(), threshold = tune())

pca_wf <- workflow() |>
  add_recipe(pca_recipe) |>
  add_model(lm_spec)
Tune the fraction of predictor variance that must be retained.
threshold_grid <- grid_regular(
  threshold(range = c(0, 1)),
  levels = 10
)

set.seed(8675309)
pca_tune_res <- pca_wf |>
  tune_grid(
    resamples = Hitters_fold,
    grid = threshold_grid
  )

pca_tune_res |>
  autoplot() +
  theme_minimal()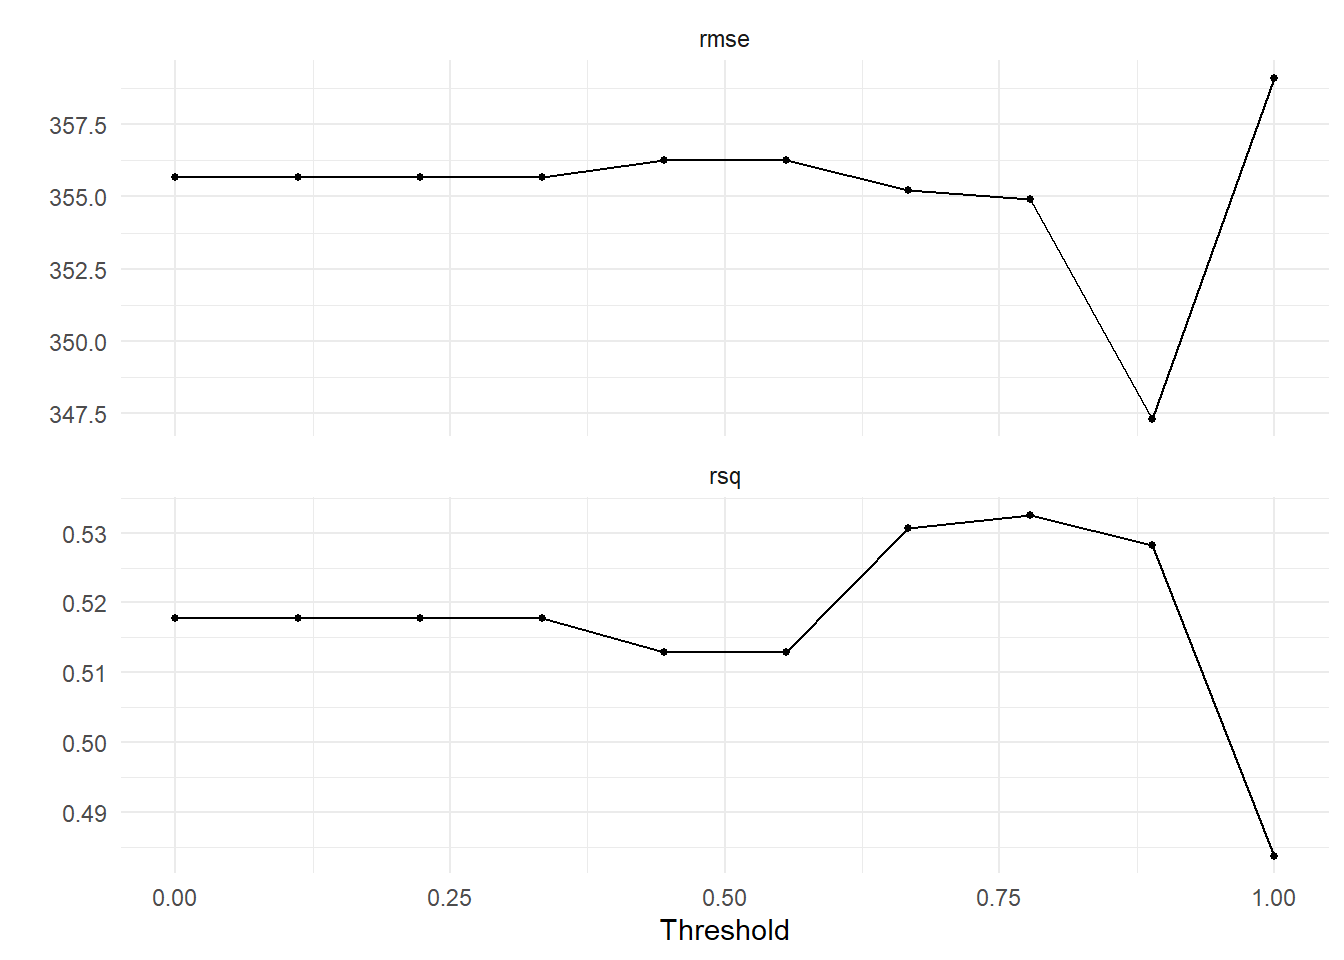
pca_tune_res |>
  show_best(metric = "rmse")
# A tibble: 5 × 7
threshold .metric .estimator mean n std_err .config
<dbl> <chr> <chr> <dbl> <int> <dbl> <chr>
1 0.889 rmse standard 347. 10 44.0 pre09_mod0_post0
2 0.778 rmse standard 355. 10 44.2 pre08_mod0_post0
3 0.667 rmse standard 355. 10 42.9 pre07_mod0_post0
4 0 rmse standard 356. 10 42.7 pre01_mod0_post0
5 0.111 rmse standard 356. 10 42.7 pre02_mod0_post0Select the best threshold and evaluate the final model.
pca_best_threshold <- pca_tune_res |>
  select_best(metric = "rmse")

pca_final_wf <- pca_wf |>
  finalize_workflow(pca_best_threshold)

pca_final_fit <- pca_final_wf |>
  fit(data = Hitters_train)

pca_test_pred <- pca_final_fit |>
  augment(new_data = Hitters_test)

pca_test_pred |>
  rmse(truth = Salary, estimate = .pred)
# A tibble: 1 × 3
.metric .estimator .estimate
<chr> <chr> <dbl>
1 rmse standard 285.pca_test_pred |>
rsq(truth = Salary, estimate = .pred)# A tibble: 1 × 3
.metric .estimator .estimate
<chr> <chr> <dbl>
1 rsq standard 0.486Use the PCR tuning results and final fitted model to describe the selected model.
Report:
Helpful output: The selected threshold is in pca_best_threshold. Use tidy(pca_final_fit) to inspect the fitted component coefficients; count non-intercept component terms to determine the number retained. Use the same test metrics as before.
PLS also creates components, but unlike PCR, it uses information about the response when constructing them.
Package note: step_pls() requires the mixOmics package. It is available through Bioconductor. The code below checks that Quarto’s R session can see the package before tuning begins.
if (!requireNamespace("mixOmics", quietly = TRUE)) {
  stop(
    "The mixOmics package is required for the PLS section. Install it in the same R library used by Quarto, for example with BiocManager::install('mixOmics')."
  )
}
pls_recipe <- recipe(Salary ~ ., data = Hitters_train) |>
step_novel(all_nominal_predictors()) |>
step_dummy(all_nominal_predictors()) |>
step_zv(all_predictors()) |>
step_normalize(all_predictors()) |>
step_pls(all_predictors(), num_comp = tune(), outcome = "Salary")
pls_wf <- workflow() |>
add_recipe(pls_recipe) |>
add_model(lm_spec)
num_comp_grid <- grid_regular(
num_comp(range = c(1, 20)),
levels = 10
)
set.seed(8675309)
pls_tune_res <- pls_wf |>
tune_grid(
resamples = Hitters_fold,
grid = num_comp_grid
)Inspect the tuning results.
pls_tune_res |>
  autoplot() +
  theme_minimal()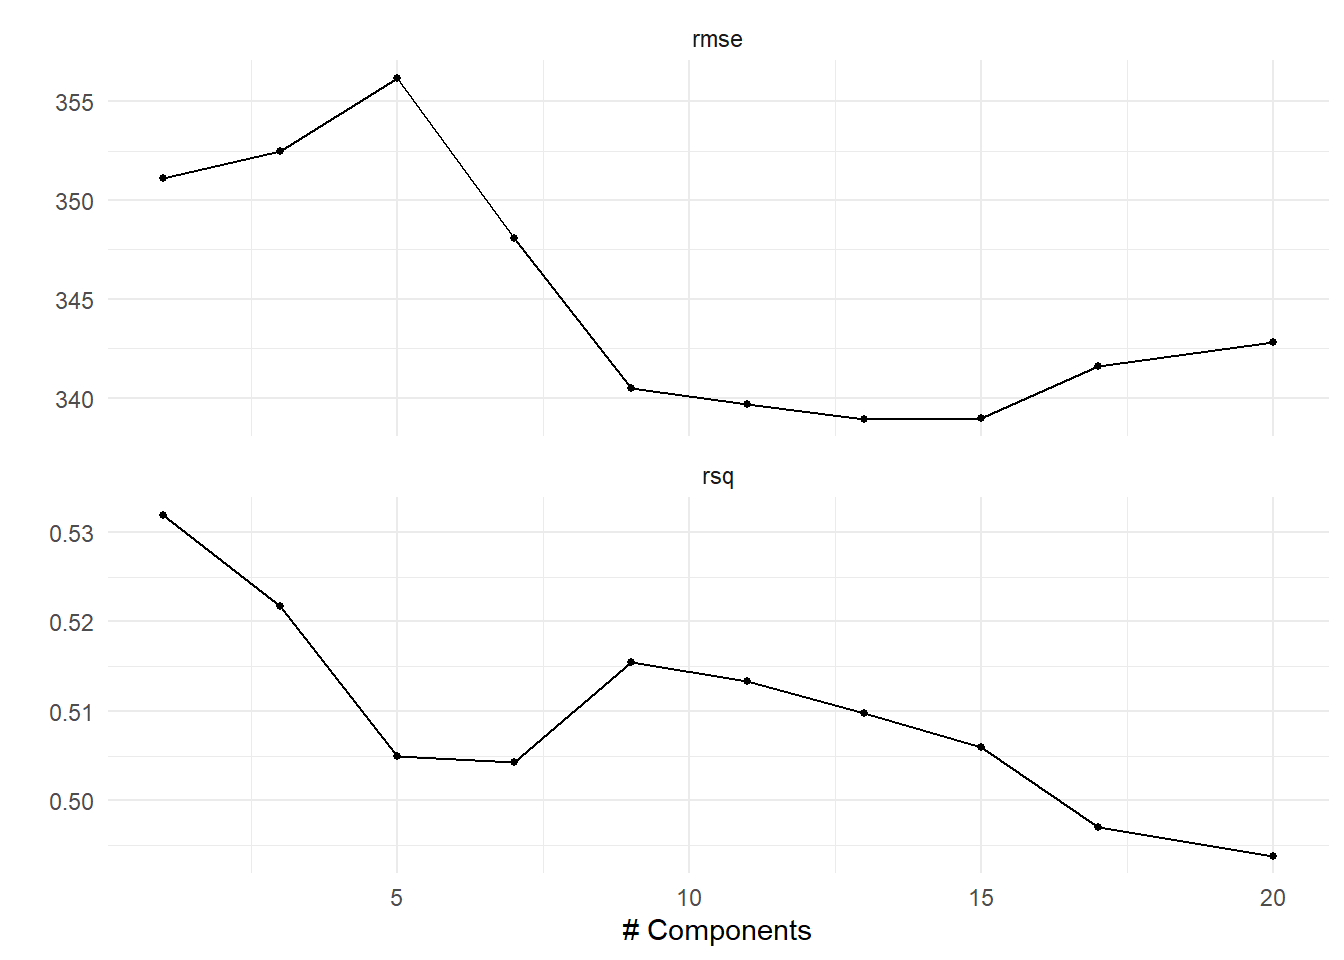
pls_tune_res |>
  show_best(metric = "rmse")
# A tibble: 5 × 7
num_comp .metric .estimator mean n std_err .config
<int> <chr> <chr> <dbl> <int> <dbl> <chr>
1 13 rmse standard 339. 10 35.8 pre07_mod0_post0
2 15 rmse standard 339. 10 36.2 pre08_mod0_post0
3 11 rmse standard 340. 10 34.4 pre06_mod0_post0
4 9 rmse standard 341. 10 33.9 pre05_mod0_post0
5 17 rmse standard 342. 10 35.6 pre09_mod0_post0Select the best number of components, finalize the workflow, and evaluate the final model.
pls_best_num_comp <- pls_tune_res |>
  select_best(metric = "rmse")

pls_final_wf <- pls_wf |>
  finalize_workflow(pls_best_num_comp)

pls_final_fit <- pls_final_wf |>
  fit(data = Hitters_train)

pls_test_pred <- pls_final_fit |>
  augment(new_data = Hitters_test)

pls_test_pred |>
  rmse(truth = Salary, estimate = .pred)
# A tibble: 1 × 3
.metric .estimator .estimate
<chr> <chr> <dbl>
1 rmse standard 339.pls_test_pred |>
rsq(truth = Salary, estimate = .pred)# A tibble: 1 × 3
.metric .estimator .estimate
<chr> <chr> <dbl>
1 rsq standard 0.346Use the PLS tuning plot, selected number of components, and test-set metrics to answer:
Helpful output: Use pls_best_num_comp, the existing autoplot() output, and the same rmse()/rsq() calculations used for the other models.
The current grid evaluates only 10 evenly spaced values between 1 and 20. Create a new grid that contains all integer values from 1 through 20, rerun the PLS tuning analysis, and select the best model by RMSE.
Compare the new result with the original PLS analysis:
Helpful output: Modify only the levels argument in grid_regular(num_comp(...)) so that each integer from 1 through 20 is considered. Reuse the remainder of the PLS code.
At this point we have final ridge, lasso, PCR, and PLS models fitted to the same training data and evaluated on the same test data.
Create a single comparison table containing one row for each of the four final models:
Include these columns:
For model complexity, use:
Use the table to answer:
Helpful output: You already created all of the individual metrics earlier in the lab. A tibble() followed by knitr::kable() is sufficient for the final summary table; no additional modeling functions are needed.