Logistic Regression
Chapter 9
Math 219
Math 219
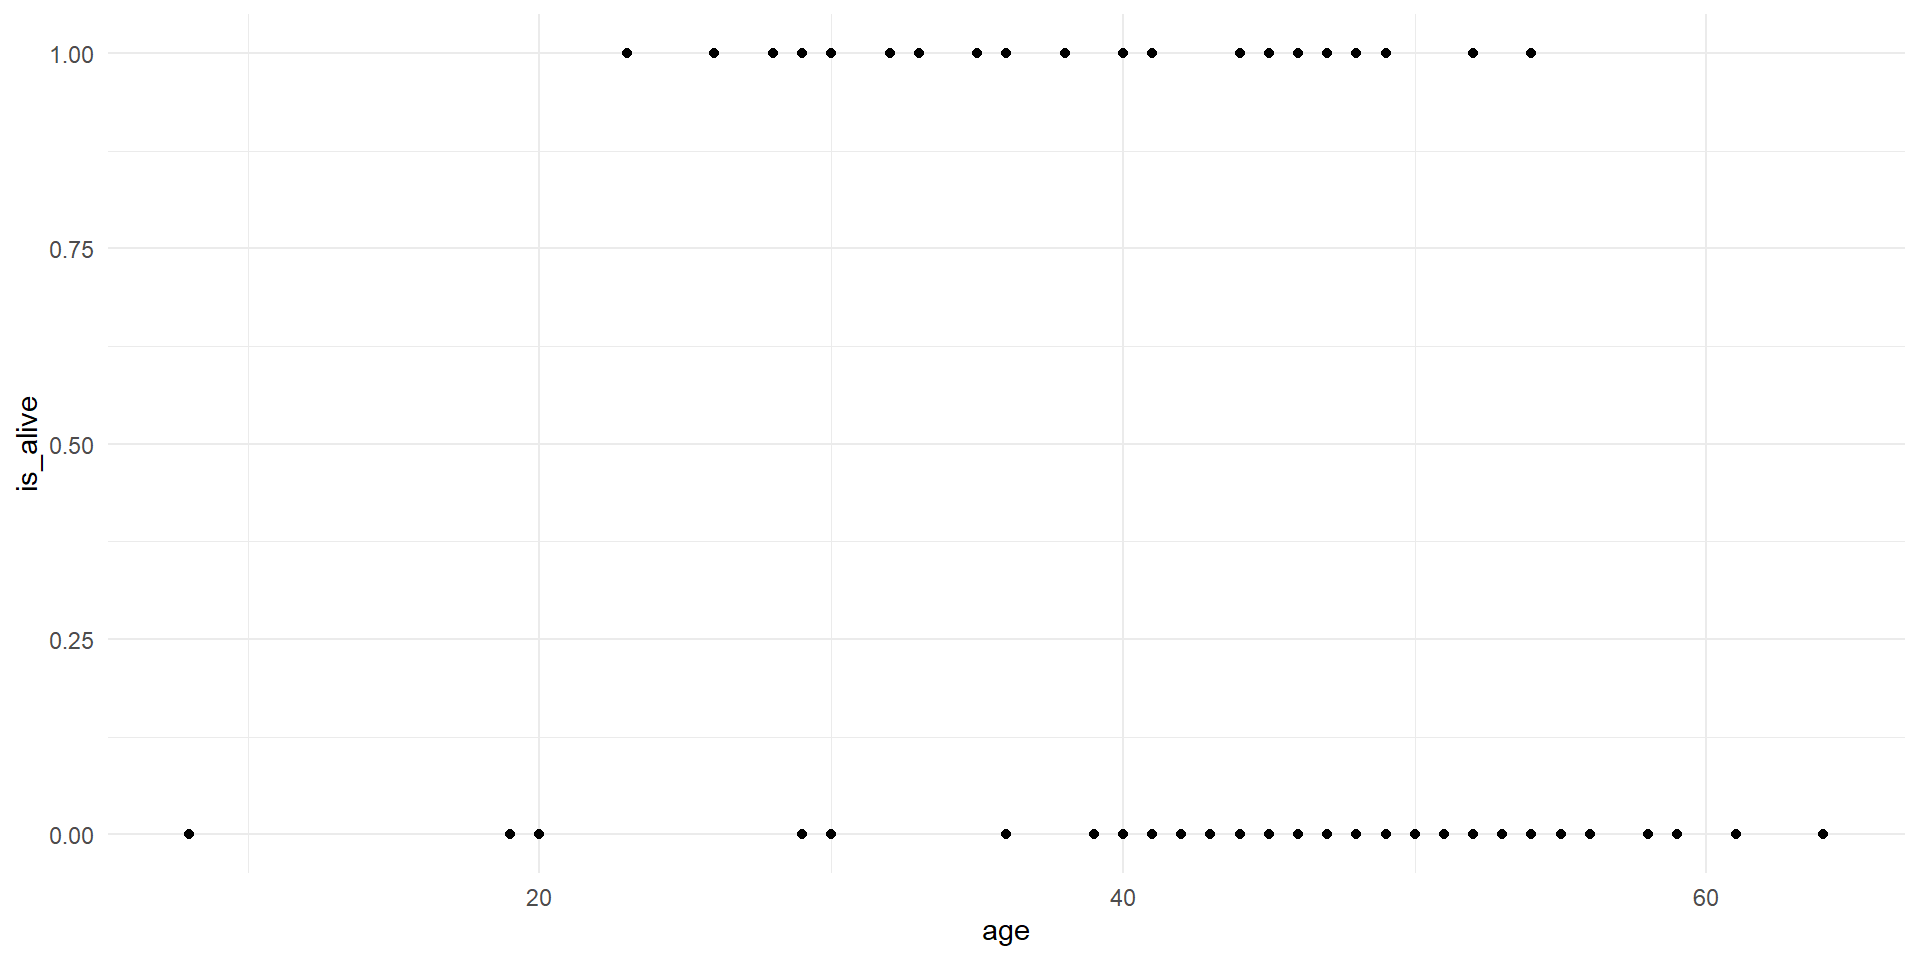
- We create an indicator variable
is_alivebased on the variablesurvived
Rows: 103
Columns: 8
$ id         <int> 15, 43, 61, 75, 6, 42, 54, 38, 85, 2, 103, 12, 48, 102, 35,…
$ acceptyear <int> 68, 70, 71, 72, 68, 70, 71, 70, 73, 68, 67, 68, 71, 74, 70,…
$ age        <int> 53, 43, 52, 52, 54, 36, 47, 41, 47, 51, 39, 53, 56, 40, 43,…
$ survived   <fct> dead, dead, dead, dead, dead, dead, dead, dead, dead, dead,…
$ survtime   <int> 1, 2, 2, 2, 3, 3, 3, 5, 5, 6, 6, 8, 9, 11, 12, 16, 16, 16, …
$ prior      <fct> no, no, no, no, no, no, no, no, no, no, no, no, no, no, no,…
$ transplant <fct> control, control, control, control, control, control, contr…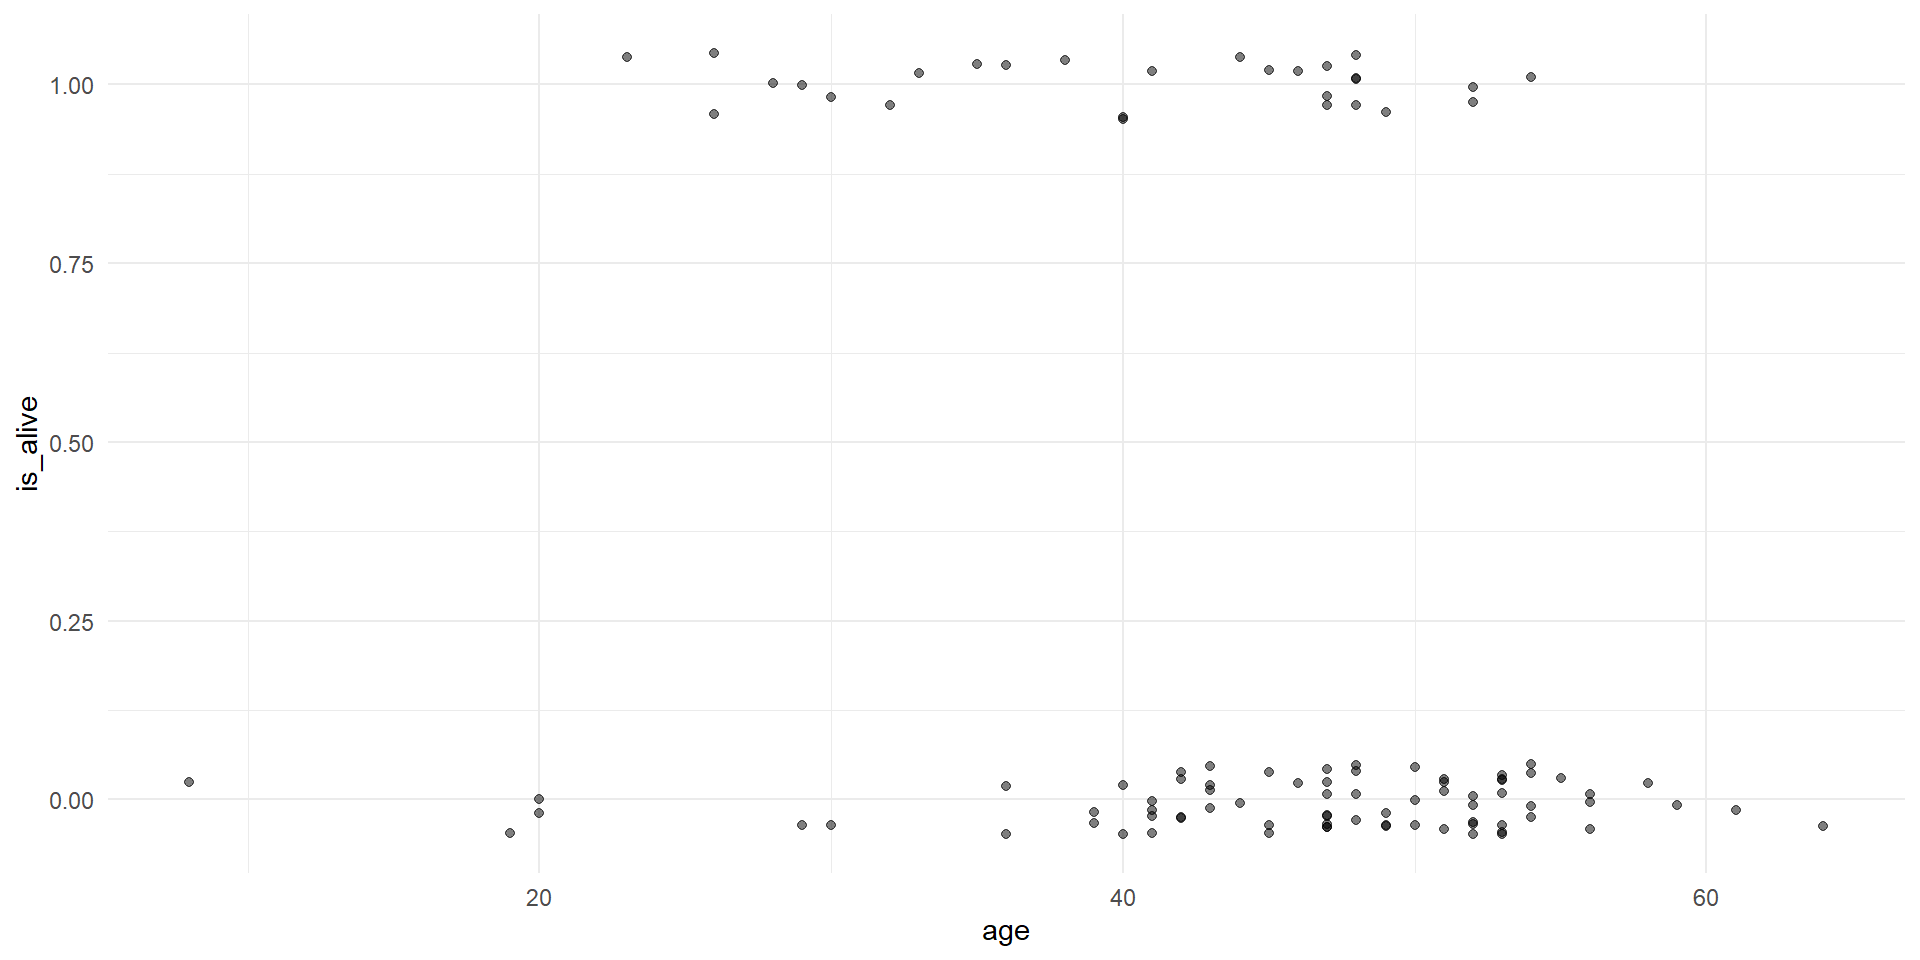
$ wait <int> NA, NA, NA, NA, NA, NA, NA, 5, NA, NA, NA, NA, NA, NA, NA, …- The original data has a lot of overlapping values
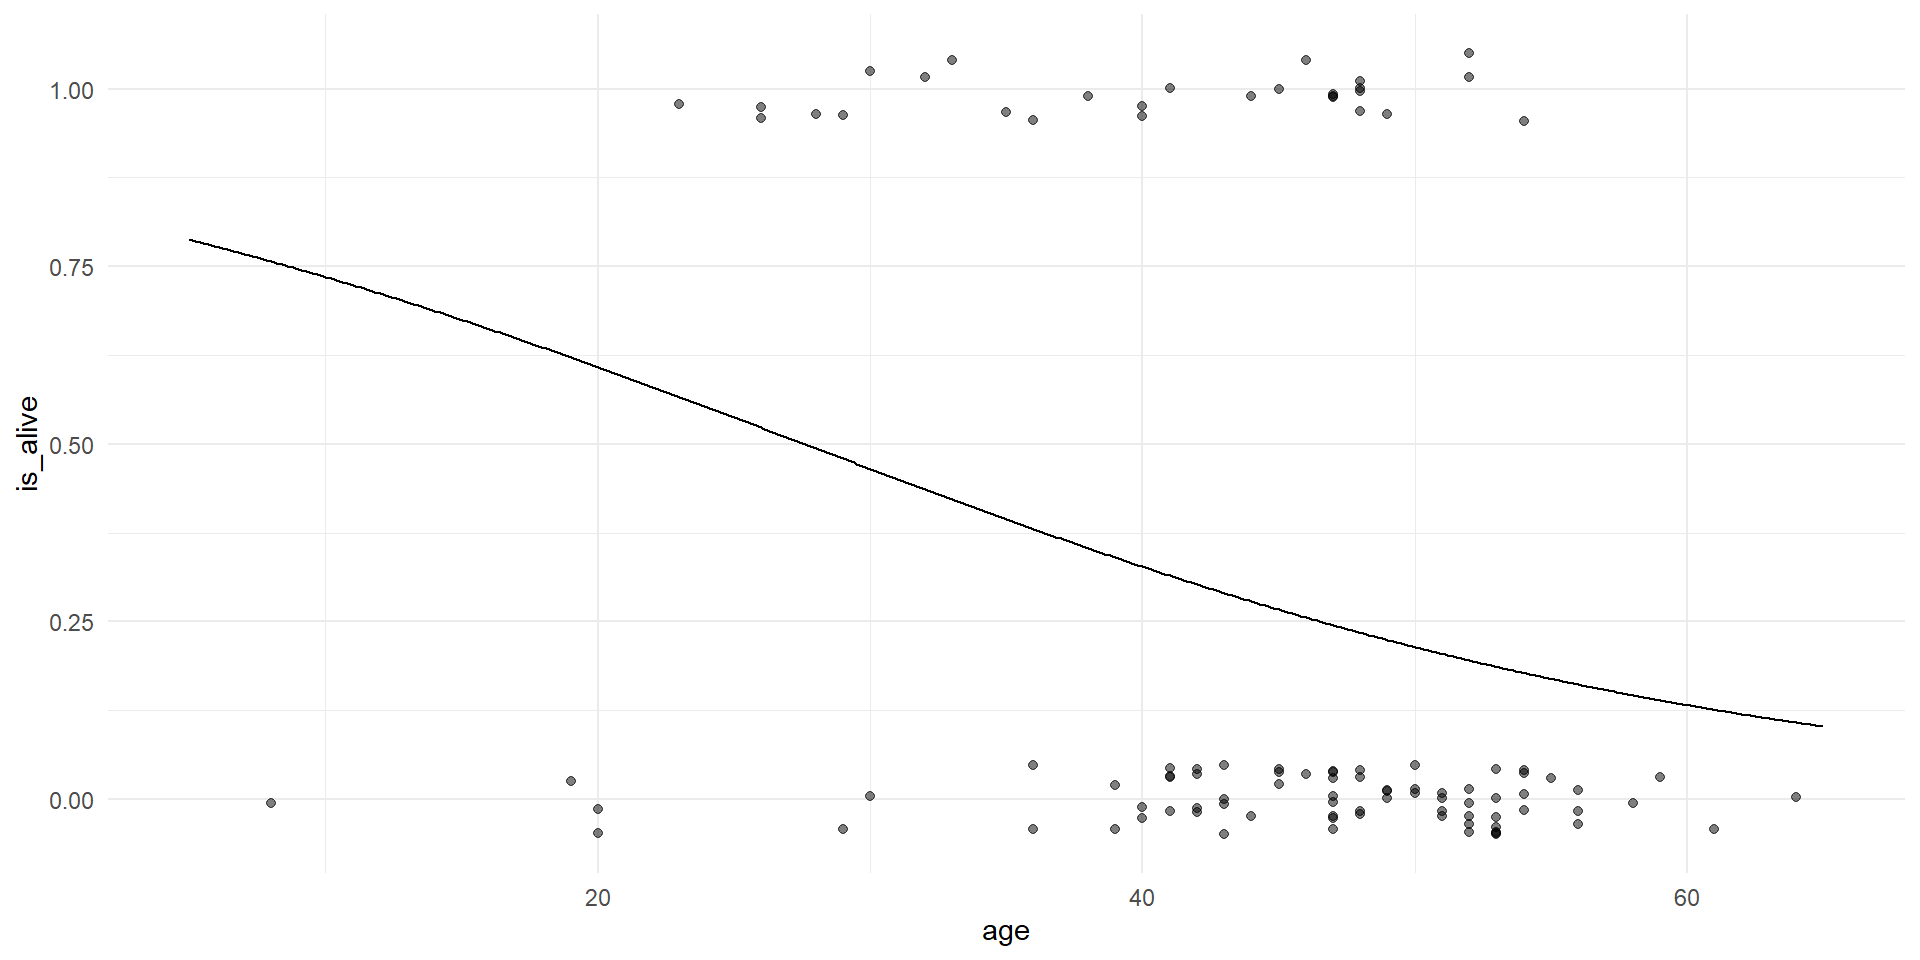
Scatter plot (jittered) showing survival vs. age. Curve shows predicted probability of survival using logistic model.