| loan_amount | interest_rate | term | grade | state | total_income | homeownership |
|---|---|---|---|---|---|---|
| 22000 | 10.90 | 60 | B | NJ | 59000 | rent |
| 6000 | 9.92 | 36 | B | CA | 60000 | rent |
| 25000 | 26.30 | 36 | E | SC | 75000 | mortgage |
| 6000 | 9.92 | 36 | B | CA | 75000 | rent |
| 25000 | 9.43 | 60 | B | OH | 254000 | mortgage |
| 6400 | 9.92 | 36 | B | IN | 67000 | mortgage |
Hello Data
Chapter 1
Math 219
Math 219
Lending Club Loans
- Random sample of 50 loans made through Lending Club platform
- A sample is a subset of a larger group (the population)
- The sample consists of the 50 loans. The population is all loans made through the platform
| loan_amount | interest_rate | term | grade | state | total_income | homeownership |
|---|---|---|---|---|---|---|
| 22000 | 10.90 | 60 | B | NJ | 59000 | rent |
| 6000 | 9.92 | 36 | B | CA | 60000 | rent |
| 25000 | 26.30 | 36 | E | SC | 75000 | mortgage |
| 6000 | 9.92 | 36 | B | CA | 75000 | rent |
| 25000 | 9.43 | 60 | B | OH | 254000 | mortgage |
| 6400 | 9.92 | 36 | B | IN | 67000 | mortgage |
- Data organized in a table called a data frame
| loan_amount | interest_rate | term | grade | state | total_income | homeownership |
|---|---|---|---|---|---|---|
| 22000 | 10.90 | 60 | B | NJ | 59000 | rent |
| 6000 | 9.92 | 36 | B | CA | 60000 | rent |
| 25000 | 26.30 | 36 | E | SC | 75000 | mortgage |
| 6000 | 9.92 | 36 | B | CA | 75000 | rent |
| 25000 | 9.43 | 60 | B | OH | 254000 | mortgage |
| 6400 | 9.92 | 36 | B | IN | 67000 | mortgage |
Each row represents a single case or observational unit
Each column represents a variable, corresponding to a loan characteristic. E.g.,
loan_amount(amount of loan in USD)term(number of months of the loan)grade(related to likelihood of being repaid)
Summary Statistics
- A summary statistic is a single number that summarizes data from a sample
- Mean loan amount ($17,083.00) is a summary statistic
- Summary statistics can be organized in tables
| grade | mean interest rate |
|---|---|
| A | 6.8 |
| B | 10.2 |
| C | 13.8 |
| D | 18.6 |
| E | 25.6 |
Association
- If there is a relationship between two variables, we say that the variables are associated
- Interest rate and loan grade appear to be associated
- If there is no relationship between two variables, we say the variables are independent
Variable Types
- A numerical variable takes on values that are described using numbers that make sense to add, subtract, average, etc
- A categorical variable takes on values that indicate different levels or categories
| loan_amount | interest_rate | term | grade | state | total_income | homeownership |
|---|---|---|---|---|---|---|
| 22000 | 10.90 | 60 | B | NJ | 59000 | rent |
| 6000 | 9.92 | 36 | B | CA | 60000 | rent |
| 25000 | 26.30 | 36 | E | SC | 75000 | mortgage |
| 6000 | 9.92 | 36 | B | CA | 75000 | rent |
| 25000 | 9.43 | 60 | B | OH | 254000 | mortgage |
| 6400 | 9.92 | 36 | B | IN | 67000 | mortgage |
Loan data variable types:
| Variable | Type |
|---|---|
| loan_amount | numerical |
| interest_rate | numerical |
| term | numerical |
| grade | categorical |
| state | categorical |
| total_income | numerical |
| homeownership | categorical |
Numerical variables can be further broken down into
- discrete: takes on discrete values (with jumps between consecutive values)
- continuous: can take on any value within a range
Categorical variables can be further broken down into
- ordinal: levels have a natural ordering
- nominal: levels do not have a natural ordering
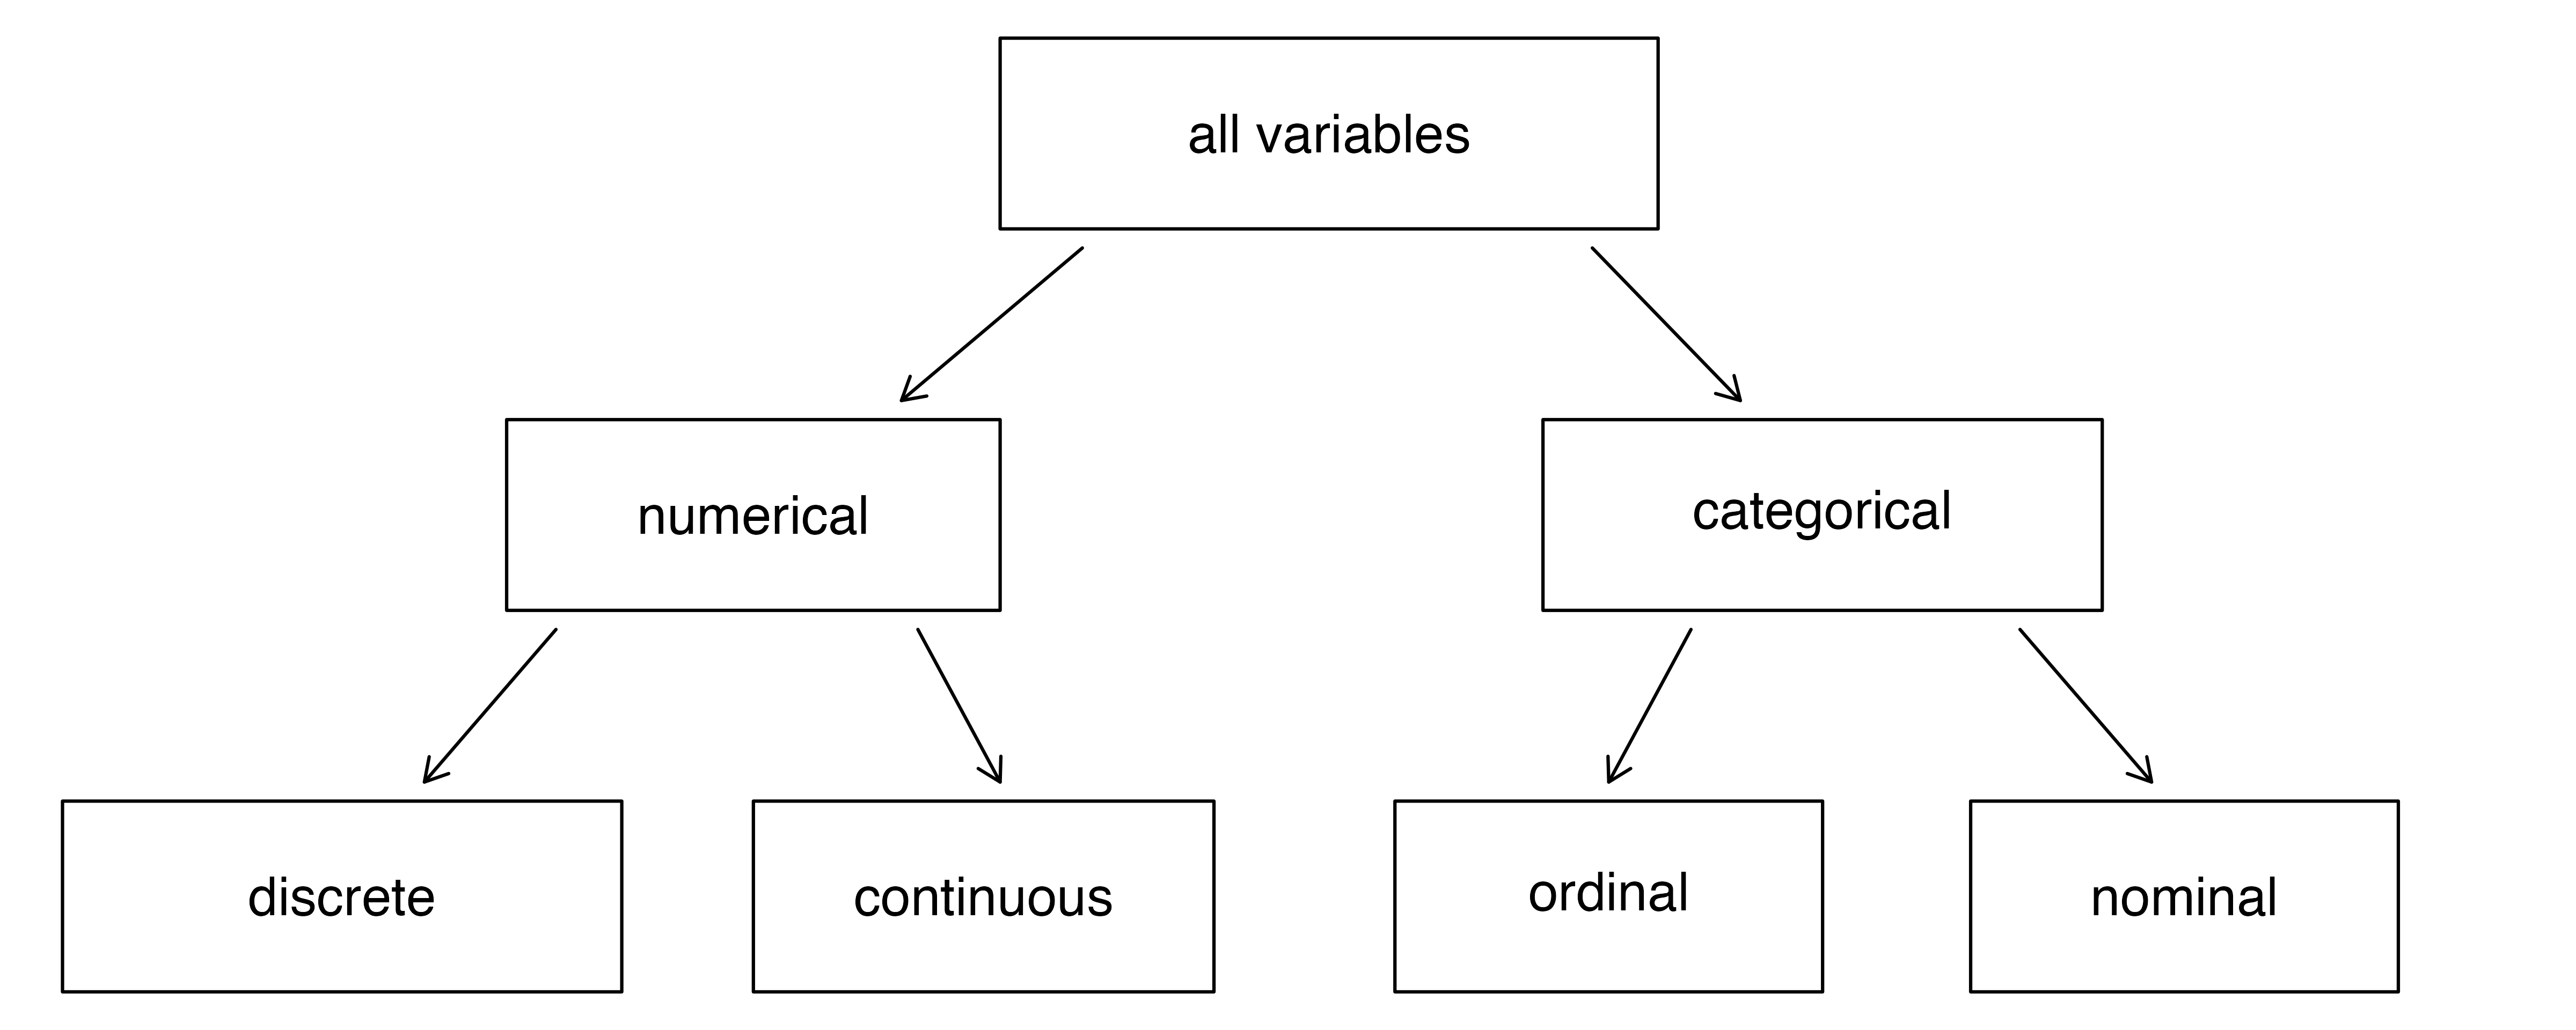
Variable types. From IMS1 Fig. 1.1.
| loan_amount | interest_rate | term | grade | state | total_income | homeownership |
|---|---|---|---|---|---|---|
| 22000 | 10.90 | 60 | B | NJ | 59000 | rent |
| 6000 | 9.92 | 36 | B | CA | 60000 | rent |
| 25000 | 26.30 | 36 | E | SC | 75000 | mortgage |
| 6000 | 9.92 | 36 | B | CA | 75000 | rent |
| 25000 | 9.43 | 60 | B | OH | 254000 | mortgage |
| 6400 | 9.92 | 36 | B | IN | 67000 | mortgage |
Loan data variable types:
| Variable | Type |
|---|---|
| loan_amount | numerical, continuous |
| interest_rate | numerical, continuous |
| term | numerical, discrete |
| grade | categorical, ordinal |
| state | categorical, nominal |
| total_income | numerical, continuous |
| homeownership | categorical, nominal |
Scatterplots
- The relationship between two numerical variables can be visualized using a scatterplot
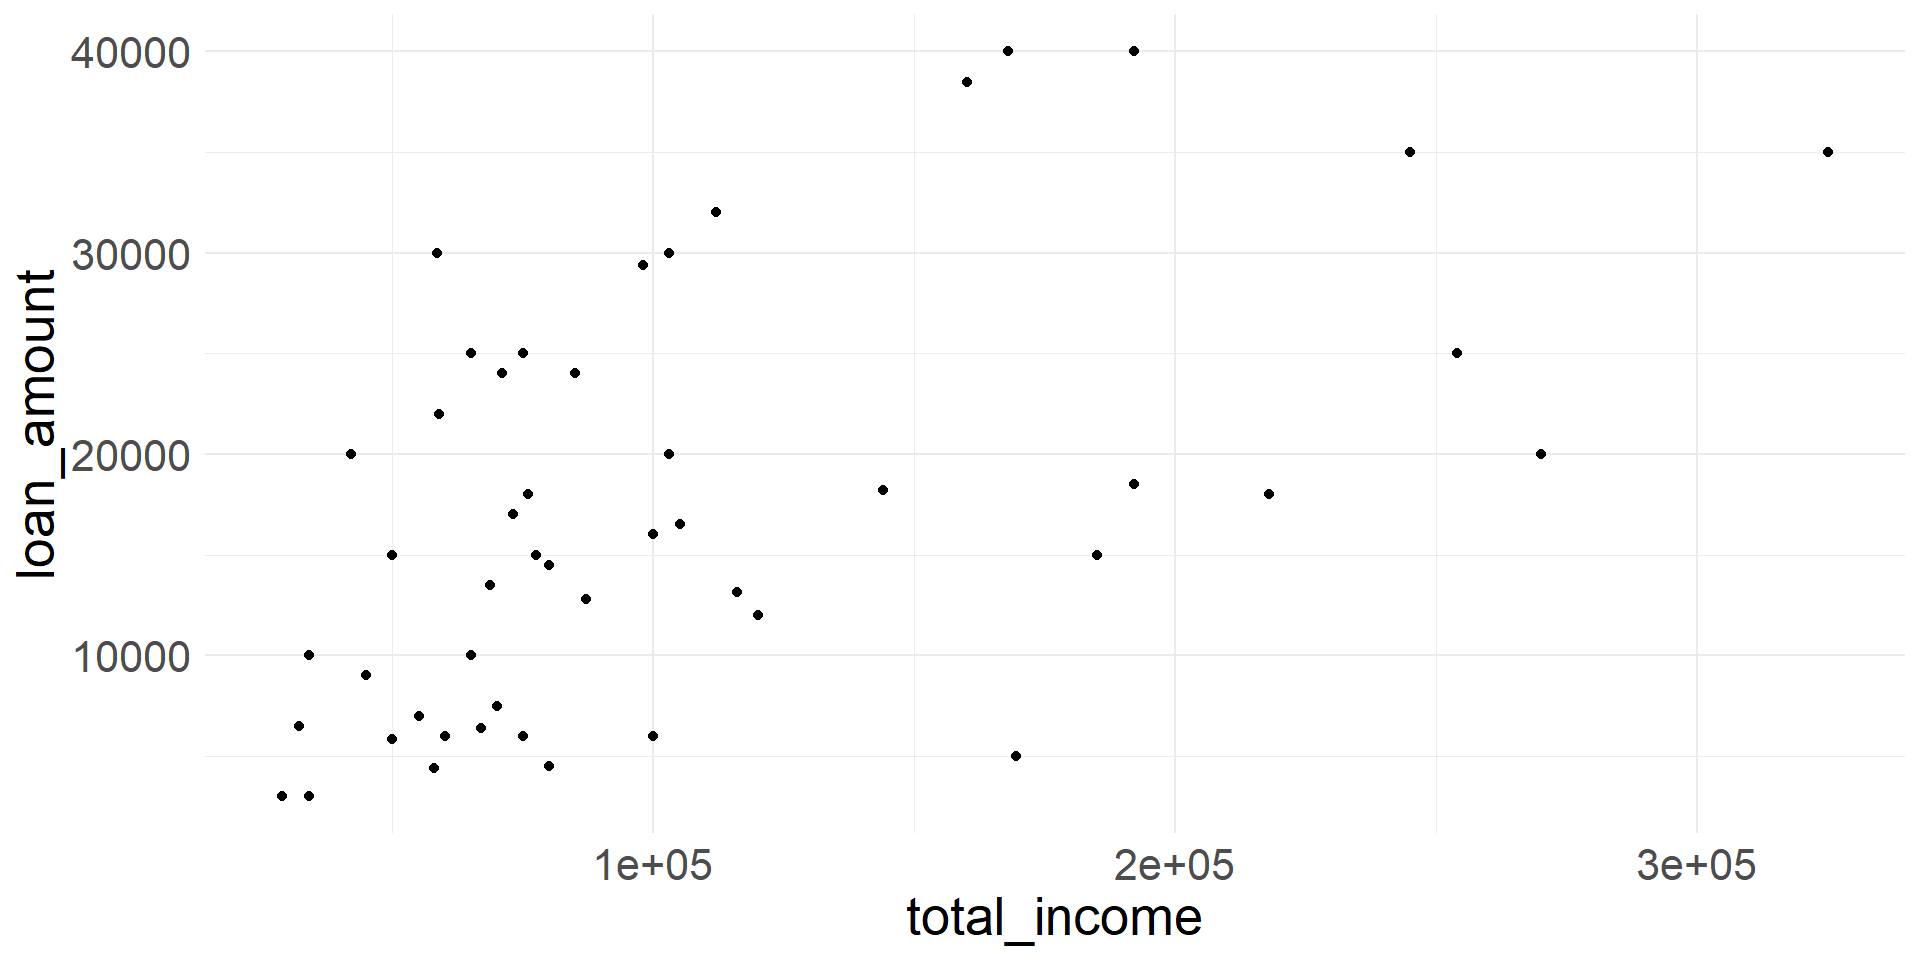
Scatterplot showing loan_amount vs. total_income.
Direction of association
- Two numerical variables are said to have a positive association if the values of one variable tend to be higher when the values of the other variable are higher
- Two numerical variables are said to have a negative association if the values of one variable tend to be lower when the values of the other variable are higher
- Variables loan_amount and total_income appear to be positively associated
Example of A Negative Association
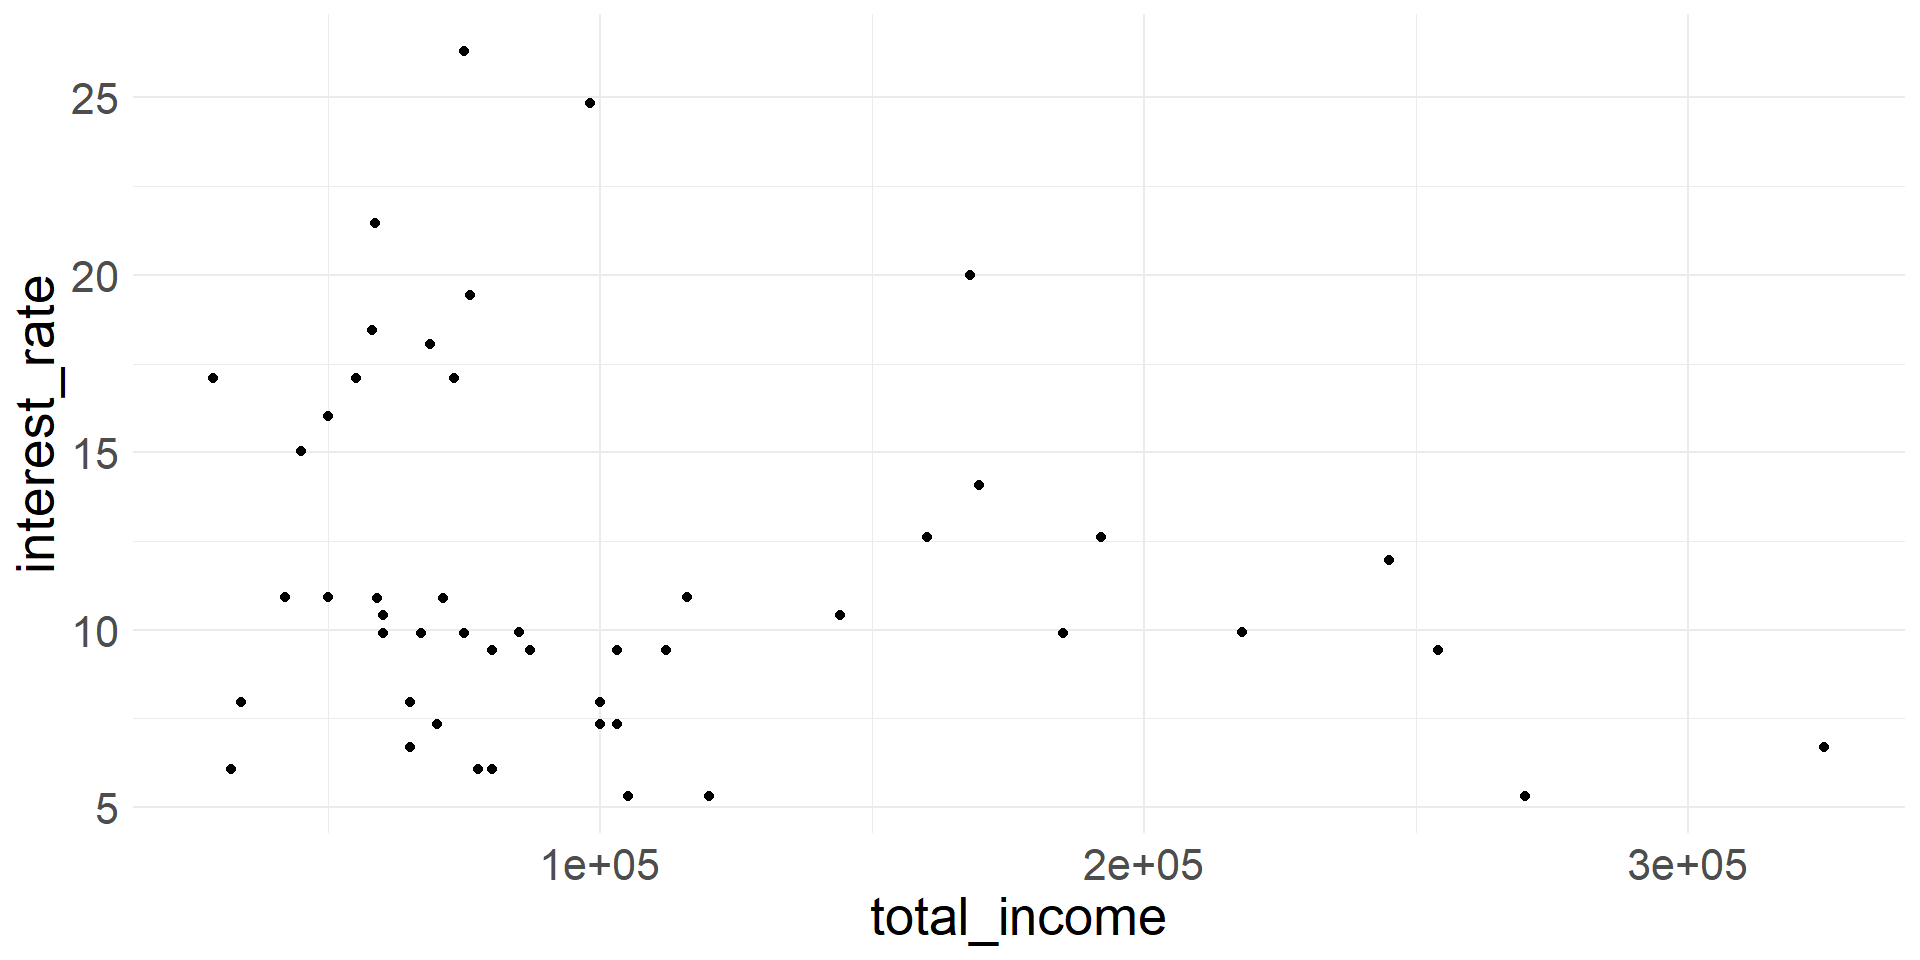
Scatterplot showing total_income vs. interest_rate.
Stents for Treating Strokes
| group | outcome |
|---|---|
| control | no event |
| treatment | no event |
| treatment | stroke |
| treatment | no event |
| control | no event |
- Researchers designed a study to study the effectiveness of stents in preventing strokes
- 451 at-risk patients randomly assigned to receive stent (treatment) or not (control)
- Outcome (“stroke” or “no event”) recorded after 365 days
| group | outcome |
|---|---|
| control | no event |
| treatment | no event |
| treatment | stroke |
| treatment | no event |
| control | no event |
- What are the cases?
- What are the variables?
- What are the variable types?
- What is the research question?
| Group | Stroke | No Event | Total |
|---|---|---|---|
| control | 28 | 199 | 227 |
| treatment | 45 | 179 | 224 |
- The proportion that had a stroke in the treatment group was 45/224 = 0.20
- The proportion that had a stroke in the control group was 28/227 = 0.12
- Does there appear to be an association between group and outcome?
Variable Roles
- When we suspect one variable might causally affect another, we label the first variable the explanatory variable and the second the response variable.
- We say that the explanatory variable affects the response variable
- The terms explanatory and response can be used to describe variables where the response might be predicted using the explanatory even if there is no causal relationship.
- In the stent study, the group (treatment or control) is the explanatory variable, and the outcome is the response variable
Visualizations
The visualization below shows the geographical distribution of airports in the contiguous United States and Washington, DC. This visualization was constructed based on a dataset where each observational unit is an airport.
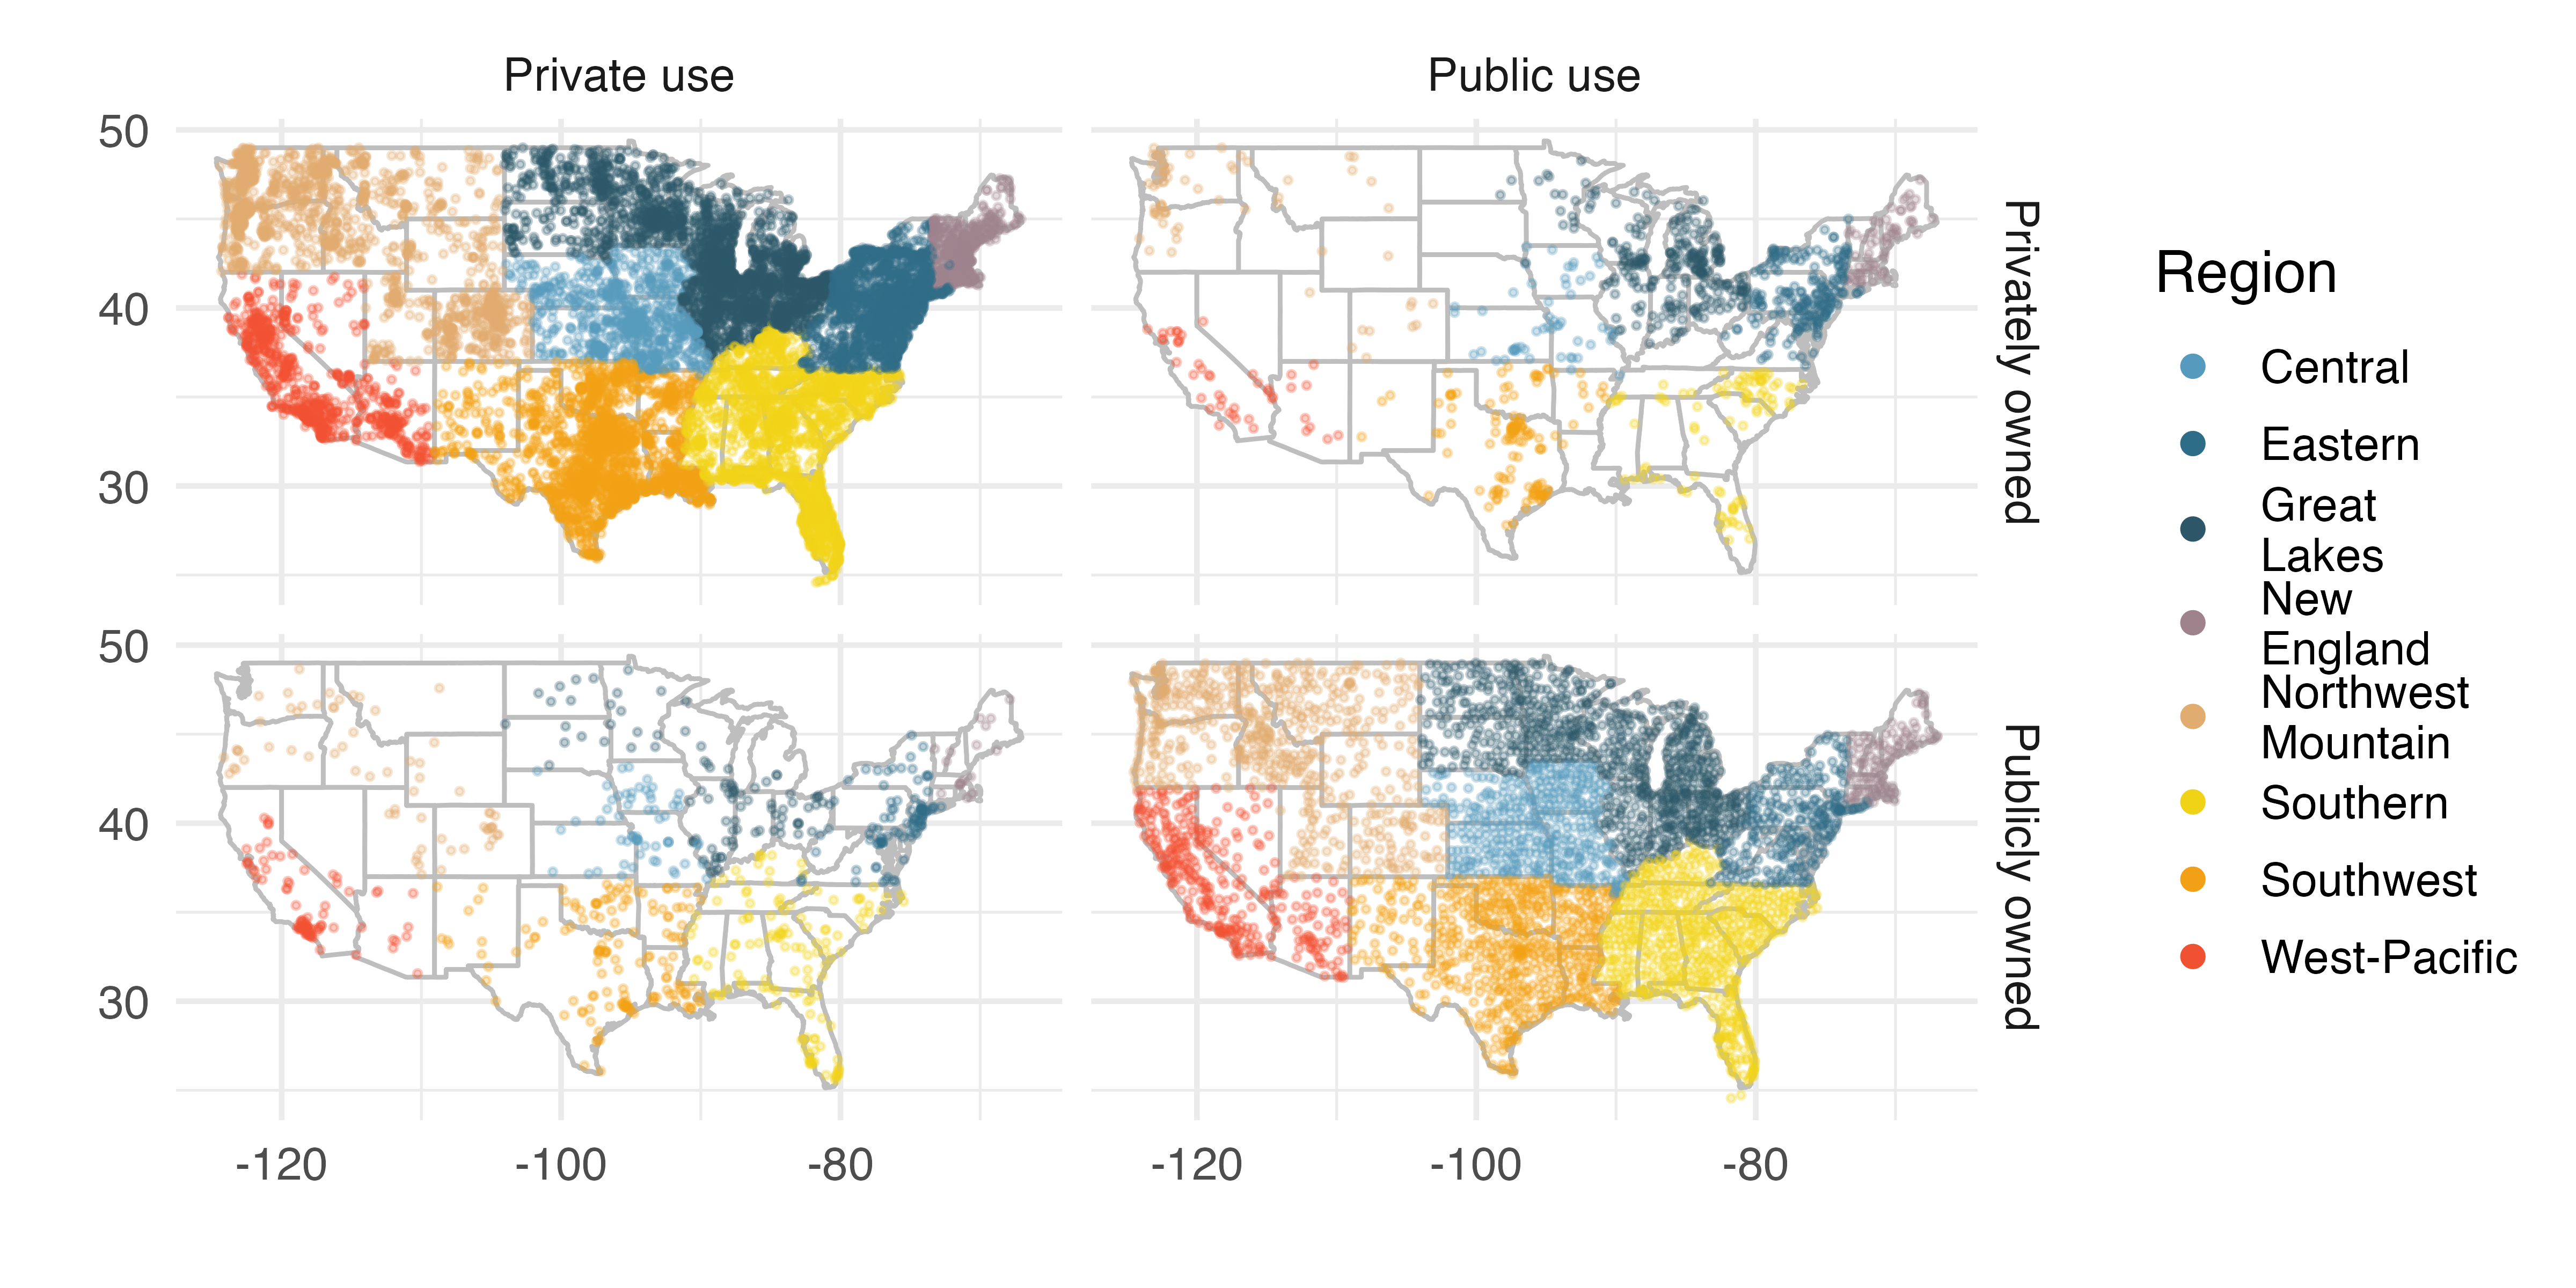
What are the variables you believe were necessary to create this visualization?
Experiment vs. Observational Study
- An experiment is a study in which researchers researchers manipulate or assign the values of the explanatory variable
- The stent study is an experiment, because the researchers assign patients to the treatment or control group
- When cases are randomly assigned to groups, the study is called a randomized experiment
- An observational study is a study without such manipulation. The cases are observed as they are
- The Lending Club data are from an observational study