Hello Data
Chapter 1
Math 215
Lending Club Loans
Six loans from the loan50 dataset
| 22000 |
10.90 |
60 |
B |
NJ |
59000 |
rent |
| 6000 |
9.92 |
36 |
B |
CA |
60000 |
rent |
| 25000 |
26.30 |
36 |
E |
SC |
75000 |
mortgage |
| 6000 |
9.92 |
36 |
B |
CA |
75000 |
rent |
| 25000 |
9.43 |
60 |
B |
OH |
254000 |
mortgage |
| 6400 |
9.92 |
36 |
B |
IN |
67000 |
mortgage |
- Random sample of 50 loans made through Lending Club platform
- A sample is a subset of a larger group (the population)
- The sample consists of the 50 loans. The population is all loans made through the platform
Six loans from the loan50 dataset
| 22000 |
10.90 |
60 |
B |
NJ |
59000 |
rent |
| 6000 |
9.92 |
36 |
B |
CA |
60000 |
rent |
| 25000 |
26.30 |
36 |
E |
SC |
75000 |
mortgage |
| 6000 |
9.92 |
36 |
B |
CA |
75000 |
rent |
| 25000 |
9.43 |
60 |
B |
OH |
254000 |
mortgage |
| 6400 |
9.92 |
36 |
B |
IN |
67000 |
mortgage |
- Data organized in a table called a data frame
Six loans from the loan50 dataset
| 22000 |
10.90 |
60 |
B |
NJ |
59000 |
rent |
| 6000 |
9.92 |
36 |
B |
CA |
60000 |
rent |
| 25000 |
26.30 |
36 |
E |
SC |
75000 |
mortgage |
| 6000 |
9.92 |
36 |
B |
CA |
75000 |
rent |
| 25000 |
9.43 |
60 |
B |
OH |
254000 |
mortgage |
| 6400 |
9.92 |
36 |
B |
IN |
67000 |
mortgage |
Each row represents a single case or observational unit
Each column represents a variable, corresponding to a loan characteristic. E.g.,
loan_amount (amount of loan in USD)term (number of months of the loan)grade (related to likelihood of being repaid)
Summary Statistics
- A summary statistic is a single number that summarizes data from a sample
- Mean loan amount ($17,083.00) is a summary statistic
- Summary statistics can be organized in tables
| A |
6.8 |
| B |
10.2 |
| C |
13.8 |
| D |
18.6 |
| E |
25.6 |
Association
- If there is a relationship between two variables, we say that the variables are associated
- Interest rate and loan grade appear to be associated
- If there is no relationship between two variables, we say the variables are independent
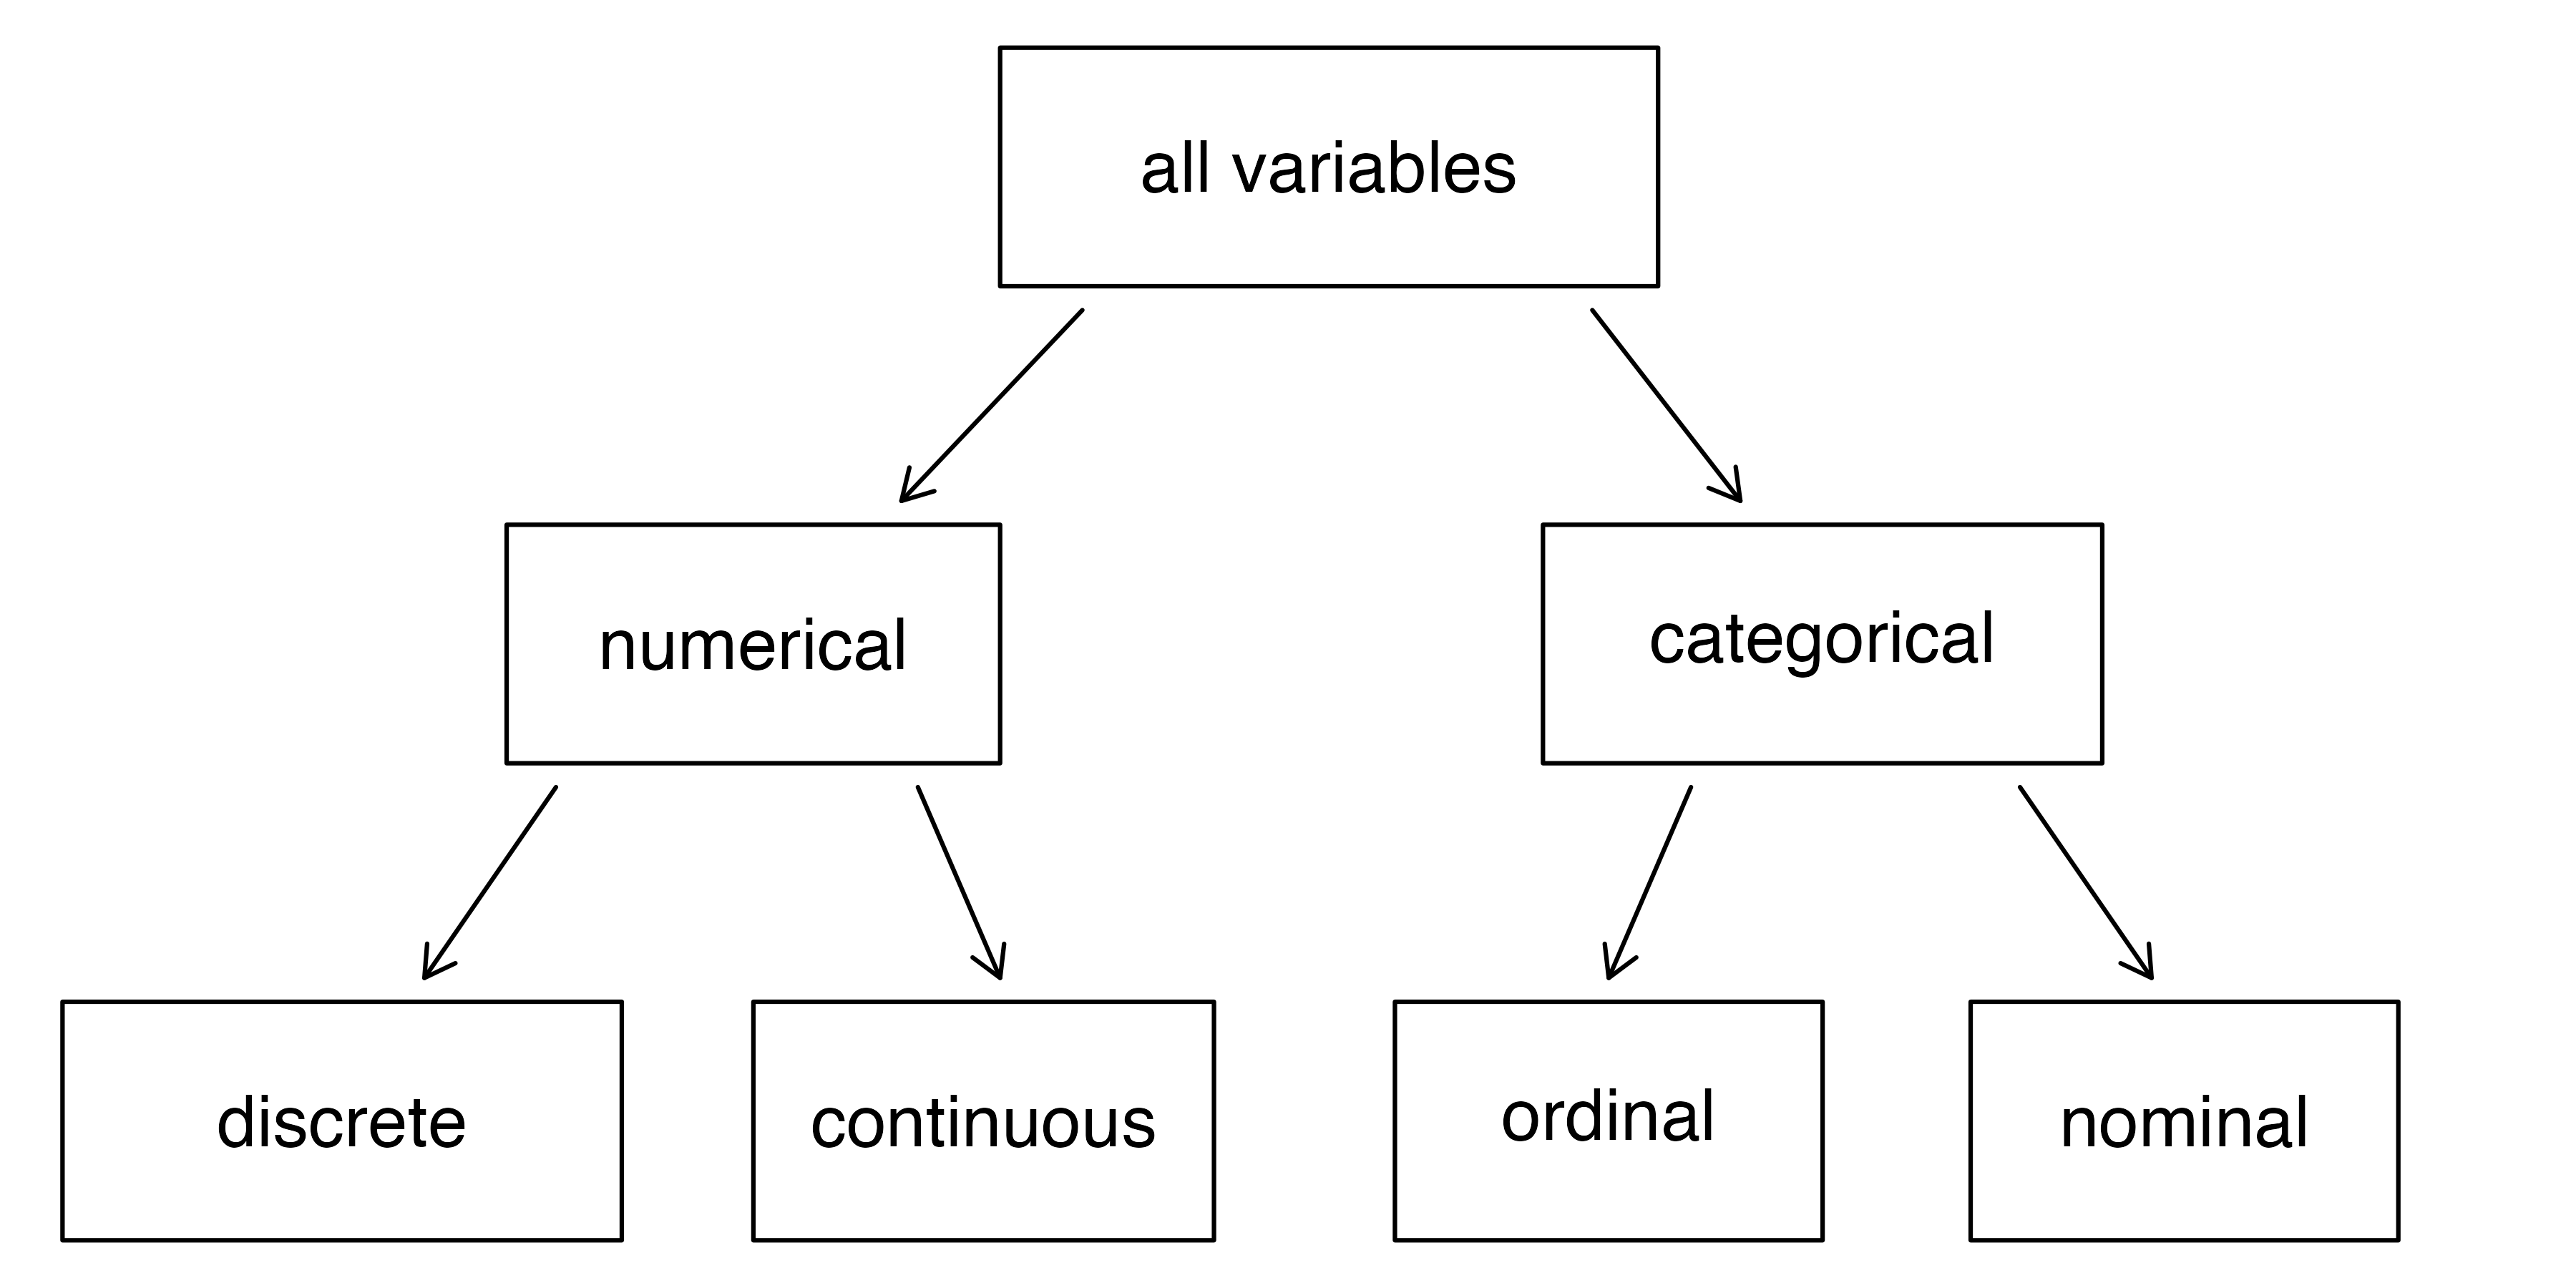
Variable Types
- A numerical variable takes on values that are described using numbers that make sense to add, subtract, average, etc
- A categorical variable takes on values that indicate different levels or categories
Six loans from the loan50 dataset
| 22000 |
10.90 |
60 |
B |
NJ |
59000 |
rent |
| 6000 |
9.92 |
36 |
B |
CA |
60000 |
rent |
| 25000 |
26.30 |
36 |
E |
SC |
75000 |
mortgage |
| 6000 |
9.92 |
36 |
B |
CA |
75000 |
rent |
| 25000 |
9.43 |
60 |
B |
OH |
254000 |
mortgage |
| 6400 |
9.92 |
36 |
B |
IN |
67000 |
mortgage |
Loan data variable types:
| loan_amount |
numerical |
| interest_rate |
numerical |
| term |
numerical |
| grade |
categorical |
| state |
categorical |
| total_income |
numerical |
| homeownership |
categorical |
![]()
Variable types. From IMS1 Fig. 1.1.
Six loans from the loan50 dataset
| 22000 |
10.90 |
60 |
B |
NJ |
59000 |
rent |
| 6000 |
9.92 |
36 |
B |
CA |
60000 |
rent |
| 25000 |
26.30 |
36 |
E |
SC |
75000 |
mortgage |
| 6000 |
9.92 |
36 |
B |
CA |
75000 |
rent |
| 25000 |
9.43 |
60 |
B |
OH |
254000 |
mortgage |
| 6400 |
9.92 |
36 |
B |
IN |
67000 |
mortgage |
Loan data variable types:
| loan_amount |
numerical, continuous |
| interest_rate |
numerical, continuous |
| term |
numerical, discrete |
| grade |
categorical, ordinal |
| state |
categorical, nominal |
| total_income |
numerical, continuous |
| homeownership |
categorical, nominal |
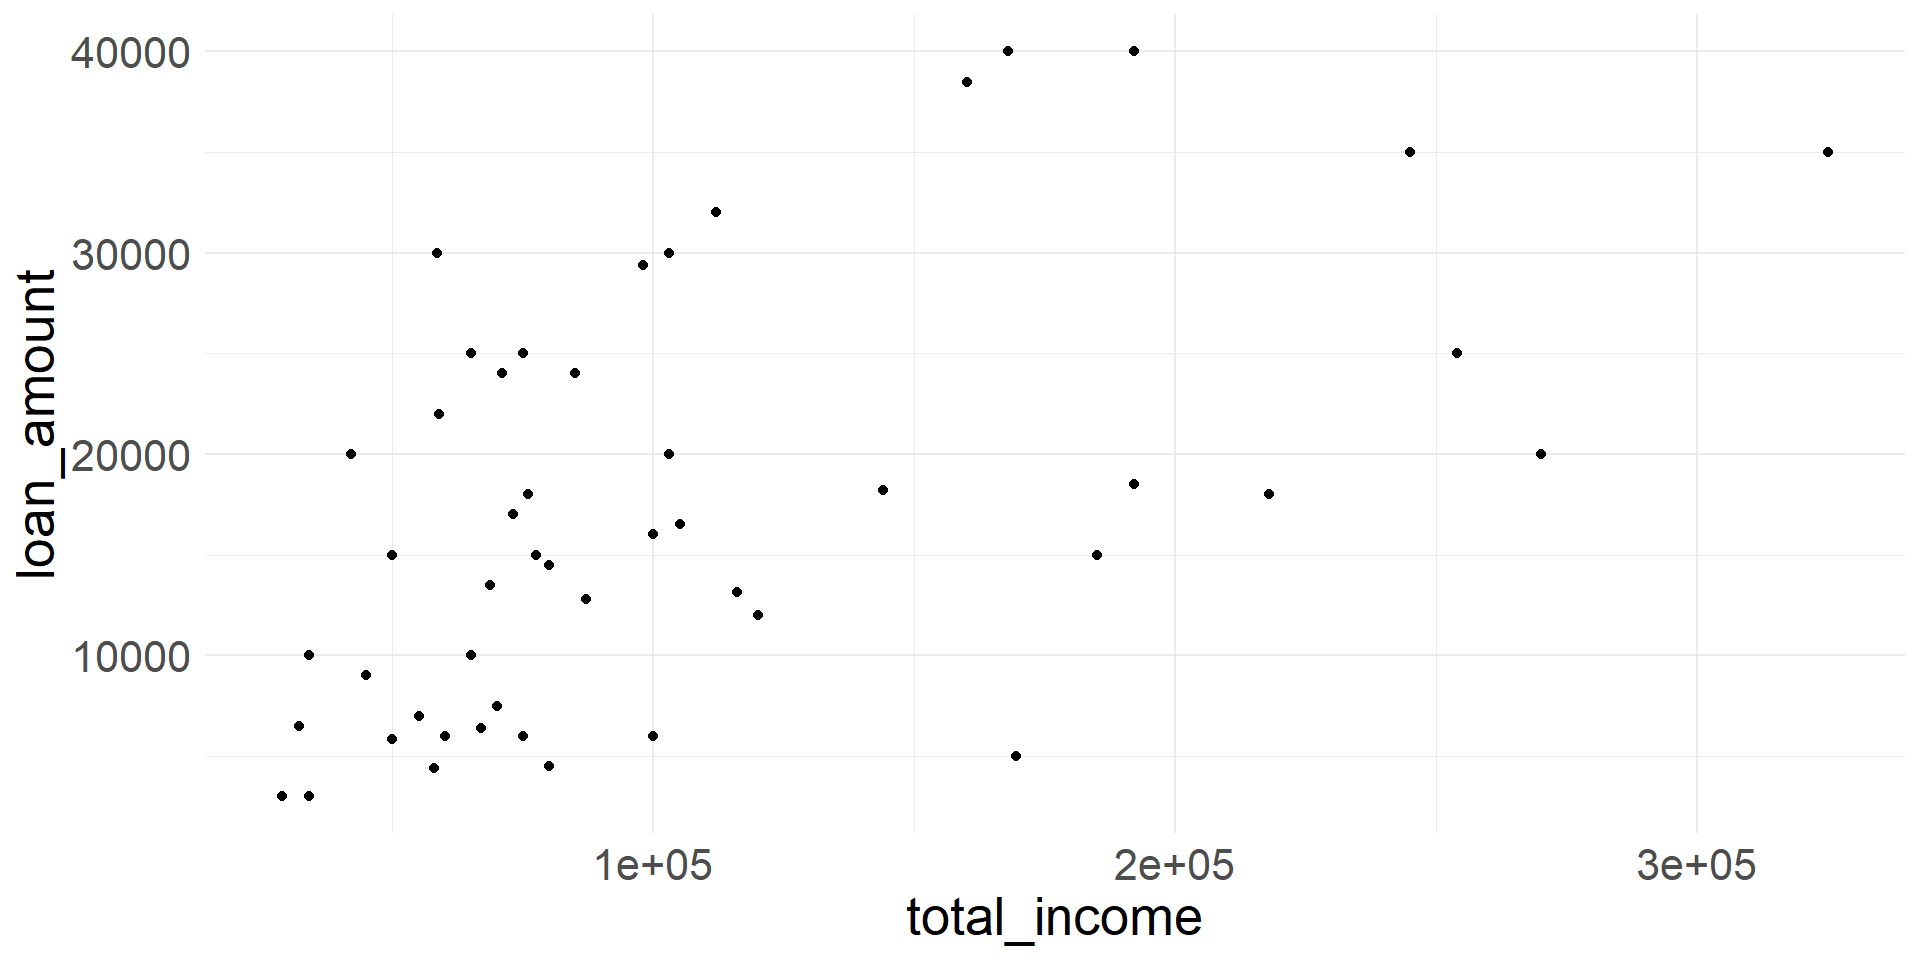
Scatterplots
- The relationship between two numerical variables can be visualized using a scatterplot
![]()
Scatterplot showing loan_amount vs. total_income.
Direction of association
- Two numerical variables are said to have a positive association if the values of one variable tend to be higher when the values of the other variable are higher
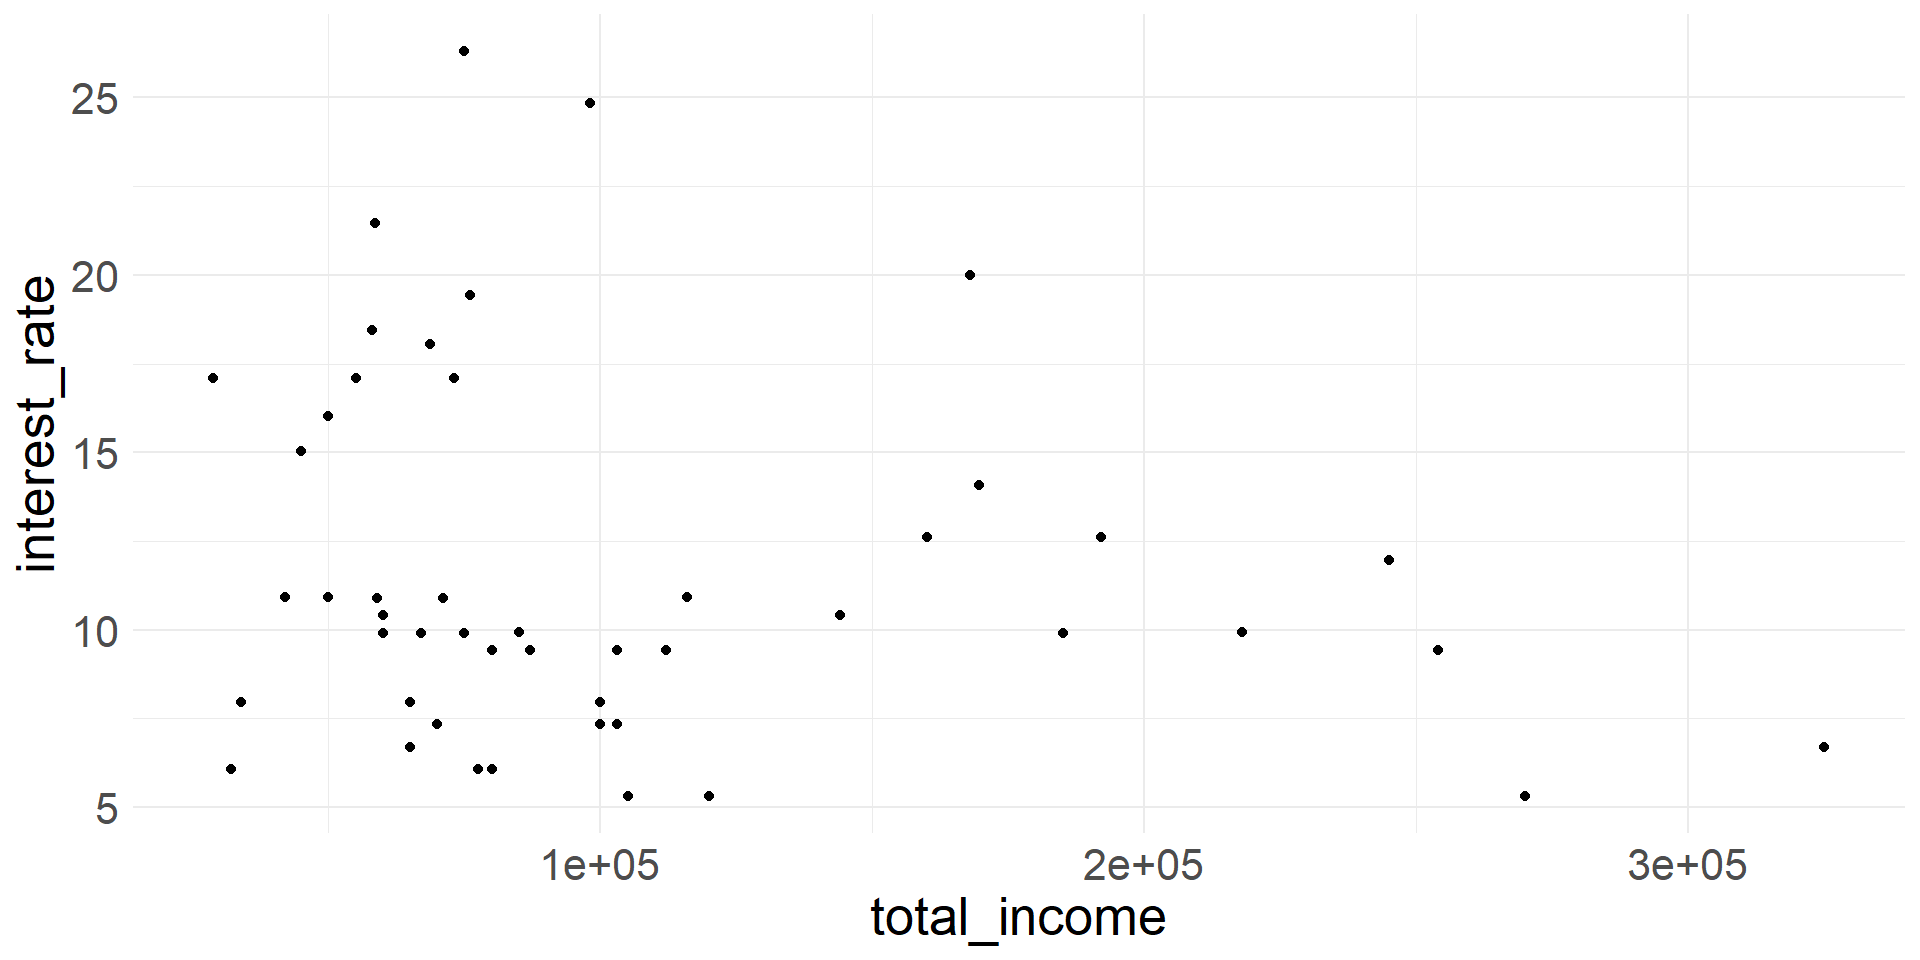
- Two numerical variables are said to have a negative association if the values of one variable tend to be lower when the values of the other variable are higher
- Variables loan_amount and total_income appear to be positively associated
Example of A Negative Association
![]()
Scatterplot showing total_income vs. interest_rate.
Stents for Treating Strokes
First five patients
| control |
no event |
| treatment |
no event |
| treatment |
stroke |
| treatment |
no event |
| control |
no event |
- Researchers designed a study to study the effectiveness of stents in preventing strokes
- 451 at-risk patients randomly assigned to receive stent (treatment) or not (control)
- Outcome (“stroke” or “no event”) recorded after 365 days
First five patients
| control |
no event |
| treatment |
no event |
| treatment |
stroke |
| treatment |
no event |
| control |
no event |
- What are the cases?
- What are the variables?
- What are the variable types?
Summary of results for stent study
| control |
28 |
199 |
227 |
| treatment |
45 |
179 |
224 |
- The proportion that had a stroke in the treatment group was 45/224 = 0.20
- The proportion that had a stroke in the control group was 28/227 = 0.12
- Does there appear to be an association between group and outcome?
Variable Roles
- When we suspect one variable might causally affect another, we label the first variable the explanatory variable and the second the response variable.
- We say that the explanatory variable affects the response variable
- The terms explanatory and response can be used to describe variables where the response might be predicted using the explanatory even if there is no causal relationship.
- In the stent study, the group (treatment or control) is the explanatory variable, and the outcome is the response variable
Experiment vs. Observational Study
- An experiment is a study in which researchers researchers manipulate or assign the values of the explanatory variable
- The stent study is an experiment, because the researchers assign patients to the treatment or control group
- When cases are randomly assigned to groups, the study is called a randomized experiment
- An observational study is a study without such manipulation. The cases are observed as they are
- The Lending Club data are from an observational study