# A tibble: 4 × 5
  term              estimate std.error statistic  p.value
  <chr>                <dbl>     <dbl>     <dbl>    <dbl>
1 (Intercept)           1.21    0.0652     18.6  2.88e-40
2 Petal.Width           1.02    0.152       6.69 4.41e-10
3 Speciesversicolor     1.70    0.181       9.38 1.17e-16
4 Speciesvirginica 2.28 0.281 8.09 2.08e-13Interactions in Linear and Logistic Models
Additional Topic
Math 215
Yurk
Iris
- The
irisdataset has 150 observations of 5 variables - Previously we fit a parallel-slopes / additive model to the relationship between petal width and petal length for 3 different species, Iris setosa, Iris versicolor, and Iris virginica
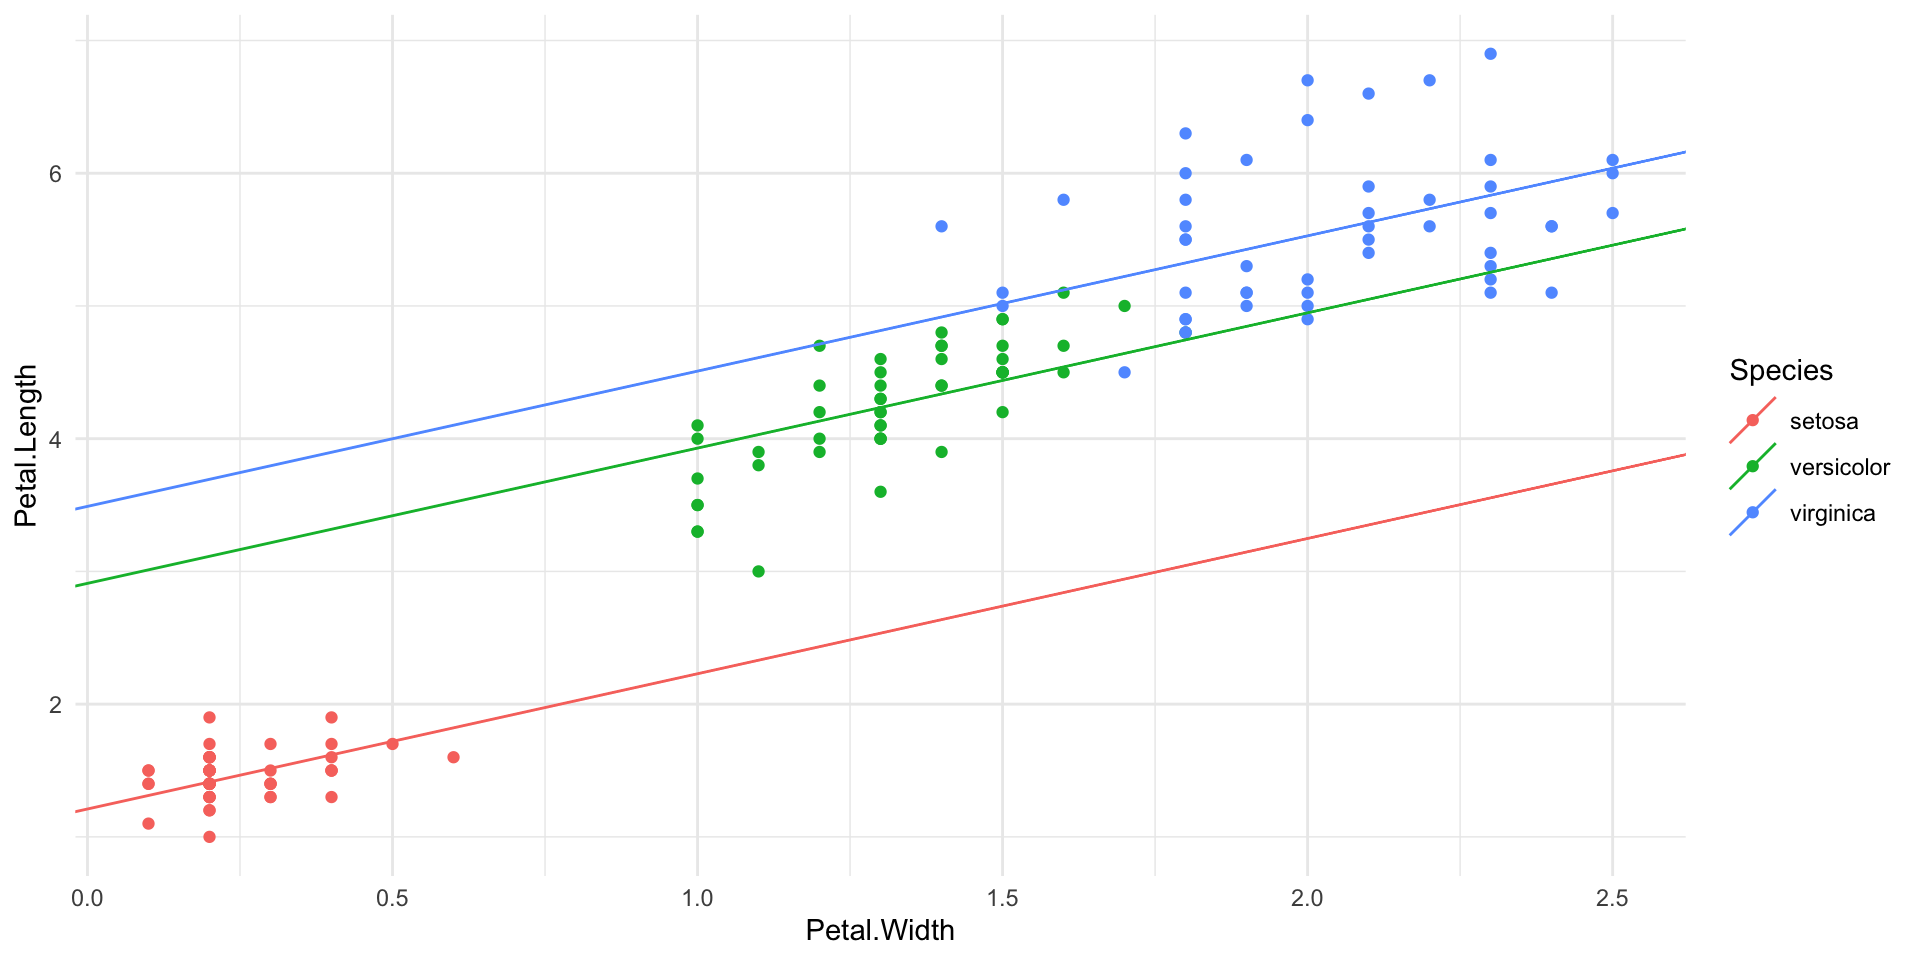
Scatter plot of petal length vs. petal width colored by species, along with parallel slopes model.
\[\widehat{Petal.Length}=\left\{\begin{array}{cl}1.21+1.02\times Petal.Width, & \textrm{if } Species = ``setosa''\\2.91+1.02\times Petal.Width, & \textrm{if } Species = ``versicolor''\\3.49+1.02\times Petal.Width, & \textrm{if } Species = ``virginica''\end{array}\right.\]
Interaction
- We can include an interaction between species and petal width in the model
- There is an interaction if different species have different relationships between the response (petal length) and petal width
- Unlike the additive model, a model with an interaction has a different slope for each species
- There is a significant interaction between species and petal width
# A tibble: 6 × 5
  term                          estimate std.error statistic  p.value
  <chr>                            <dbl>     <dbl>     <dbl>    <dbl>
1 (Intercept)                      1.33      0.131    10.1   1.45e-18
2 Petal.Width                      0.546     0.490     1.12  2.67e- 1
3 Speciesversicolor                0.454     0.374     1.21  2.27e- 1
4 Speciesvirginica                 2.91      0.406     7.17  3.53e-11
5 Petal.Width:Speciesversicolor    1.32      0.555     2.38  1.85e- 2
6 Petal.Width:Speciesvirginica     0.101     0.525     0.192 8.48e- 1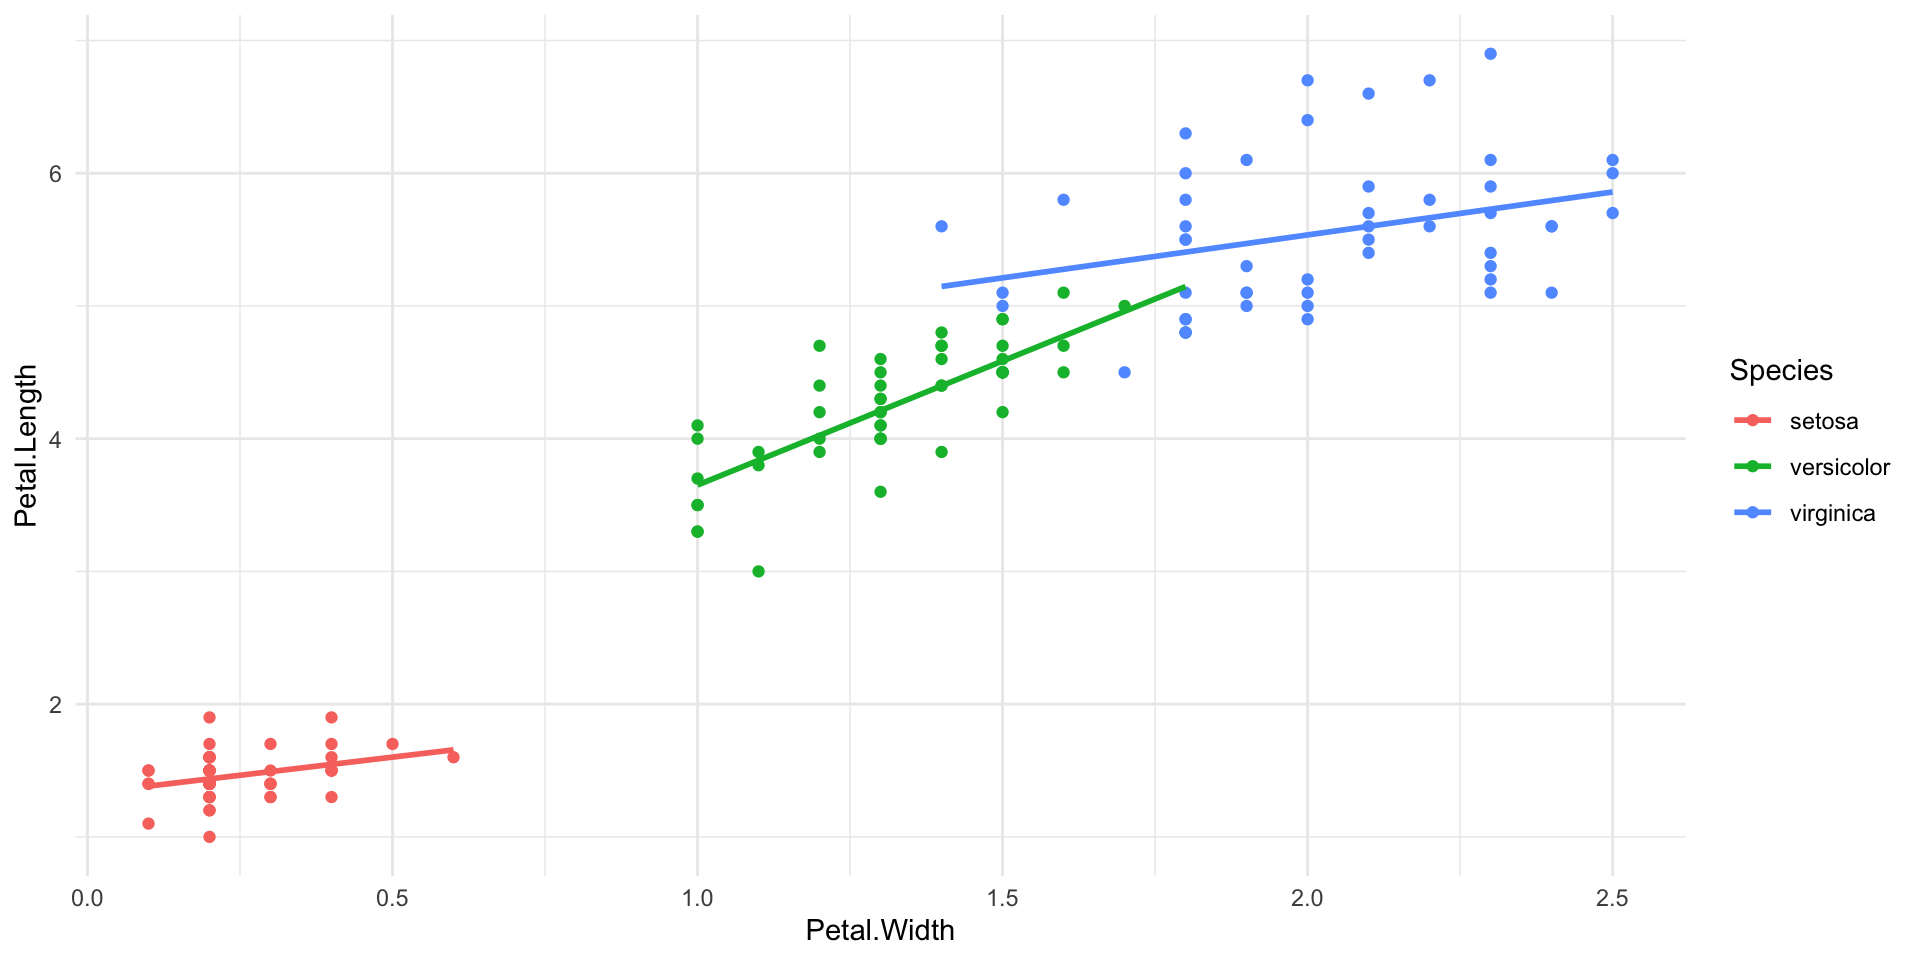
Scatter plot of petal length vs. petal width colored by species, along with model with interaction.
\[\widehat{Petal.Length}=\left\{\begin{array}{cl}1.33+0.55\times Petal.Width, & \textrm{if } Species = ``setosa''\\1.78+1.09\times Petal.Width, & \textrm{if } Species = ``versicolor''\\4.24+0.65\times Petal.Width, & \textrm{if } Species = ``virginica''\end{array}\right.\]
Palmer Penguins
penguinsdataset 1- Measurements for three species of penguins from Palmer Archipelago
- Previously, we considered an additive model predicting body mass using bill depth, flipper length, and sex
Three-way interaction
- With three predictors we can evaluate whether or not there is evidence of a three-way interaction
- A three-way interaction is more difficult to interpret than a two-way interaction
# A tibble: 8 × 5
  term                                     estimate std.error statistic  p.value
  <chr>                                       <dbl>     <dbl>     <dbl>    <dbl>
1 (Intercept)                             -39789.     6398.       -6.22 1.54e- 9
2 bill_depth_mm                             2198.      394.        5.58 4.95e- 8
3 sexmale                                  16903.     9041.        1.87 6.24e- 2
4 flipper_length_mm                          222.       31.6       7.01 1.42e-11
5 bill_depth_mm:sexmale                    -1054.      534.       -1.97 4.94e- 2
6 bill_depth_mm:flipper_length_mm            -11.2       1.97     -5.71 2.56e- 8
7 sexmale:flipper_length_mm                  -79.2      44.0      -1.80 7.27e- 2
8 bill_depth_mm:sexmale:flipper_length_mm 5.14 2.63 1.95 5.16e- 2- The three-way interaction is not significant, so we drop it from the model and consider the possible two-way interactions
- Of these, the only two-way interaction that is significant is between flipper length and bill depth
- Drop the others from the model
# A tibble: 7 × 5
  term                             estimate std.error statistic  p.value
  <chr>                               <dbl>     <dbl>     <dbl>    <dbl>
1 (Intercept)                     -30542.     4324.      -7.06  9.91e-12
2 bill_depth_mm                     1624.      263.       6.18  1.92e- 9
3 sexmale                           -561.     1365.      -0.411 6.81e- 1
4 flipper_length_mm                  176.       21.2      8.28  3.28e-15
5 bill_depth_mm:sexmale              -11.5      31.3     -0.369 7.12e- 1
6 sexmale:flipper_length_mm            6.30      4.52     1.39  1.64e- 1
7 bill_depth_mm:flipper_length_mm -8.35 1.31 -6.38 6.22e-10- The negative coefficient for the interaction between flipper length and bill depth indicates that the rate at which body mass increases with bill depth decreases as flipper length increases
# A tibble: 5 × 5
  term                             estimate std.error statistic  p.value
  <chr>                               <dbl>     <dbl>     <dbl>    <dbl>
1 (Intercept)                     -28121.     4201.       -6.69 9.44e-11
2 sexmale                            498.       49.0      10.2  2.75e-21
3 bill_depth_mm                     1434.      245.        5.85 1.16e- 8
4 flipper_length_mm                  164.       20.3       8.07 1.36e-14
5 bill_depth_mm:flipper_length_mm     -7.43      1.20     -6.22 1.51e- 9
The model
\[\begin{array}{rcl}\widehat{body\_mass\_g} &=& -28121 + 498\times sexmale \\ & & + 1434 \times bill\_depth\_mm \\ & & + 164\times flipper\_length\_mm \\ & & - 7.34 \times bill\_depth\_mm\times flipper\_length\_mm \end{array}\]
can also be written as
\[\begin{array}{rcl}\widehat{body\_mass\_g} &=& -28121 + 498\times sexmale \\ & & + 164\times flipper\_length\_mm \\ & & +(1434 - 7.34 \times flipper\_length\_mm)\times bill\_depth\_mm\end{array}\]
Discrimination in Hiring
- Does perceived race or sex of an applicant affect job application callback rates?
- Randomly assigned a name to each resume
- Name implied applicant’s race (Black or White) and sex (male or female)
- Previously we fit a logistic model to predict the probability of receiving a call back using job city, years experience, honors, and race
- All of these predictors are statistically significant, including race
glm(received_callback ~ job_city + years_experience + honors + race,
    family = binomial, data = resume) |>
  tidy()
# A tibble: 5 × 5
term estimate std.error statistic p.value
<chr> <dbl> <dbl> <dbl> <dbl>
1 (Intercept) -2.77 0.134 -20.6 1.45e-94
2 job_cityChicago -0.350 0.109 -3.22 1.29e- 3
3 years_experience 0.0264 0.00958 2.76 5.85e- 3
4 honors 0.793 0.183 4.34 1.43e- 5
5 racewhite 0.440 0.108 4.08 4.55e- 5- Is there evidence of an interaction between race and any of the other predictors?
- For example, does the relationship between the probability of receiving a call back and years of experience depend on the race of the applicant?
- Let’s test all of the possible two-way interactions involving race
- We do not find convincing evidence of an interaction between race an any of the other predictors
- We would proceed using the earlier model without interactions
glm(received_callback ~ job_city*race + years_experience*race +
      honors*race, family = binomial, data = resume) |>
  tidy()
# A tibble: 8 × 5
term estimate std.error statistic p.value
<chr> <dbl> <dbl> <dbl> <dbl>
1 (Intercept) -2.83 0.185 -15.3 1.27e-52
2 job_cityChicago -0.319 0.170 -1.87 6.13e- 2
3 racewhite 0.534 0.241 2.22 2.66e- 2
4 years_experience 0.0320 0.0148 2.17 3.00e- 2
5 honors 0.703 0.290 2.42 1.54e- 2
6 job_cityChicago:racewhite -0.0535 0.221 -0.242 8.09e- 1
7 racewhite:years_experience -0.00947 0.0194 -0.488 6.25e- 1
8 racewhite:honors 0.151 0.374 0.403 6.87e- 1