Comparing Two Proportions
IMS1 Ch. 17
Math 215
CPR Study
- Revisit
cpr1 dataset we explored in Ch. 14 - 2 variables
- group: treatment (received blood thinner) or control (did not)
- outcome: died or survived (for at least 24 hours)
- 90 patients (40 treatment, 50 control, randomly assigned)
Hypotheses:
- \(H_0\): Blood thinners do not affect survival rate. \(p_T-p_C = 0\)
- \(H_A\): Blood thinners affect survival rate. \(p_T-p_C \neq 0\)
Data:
| group | died | survived | total |
|---|---|---|---|
| control | 39 | 11 | 50 |
| treatment | 26 | 14 | 40 |
| total | 65 | 25 | 90 |
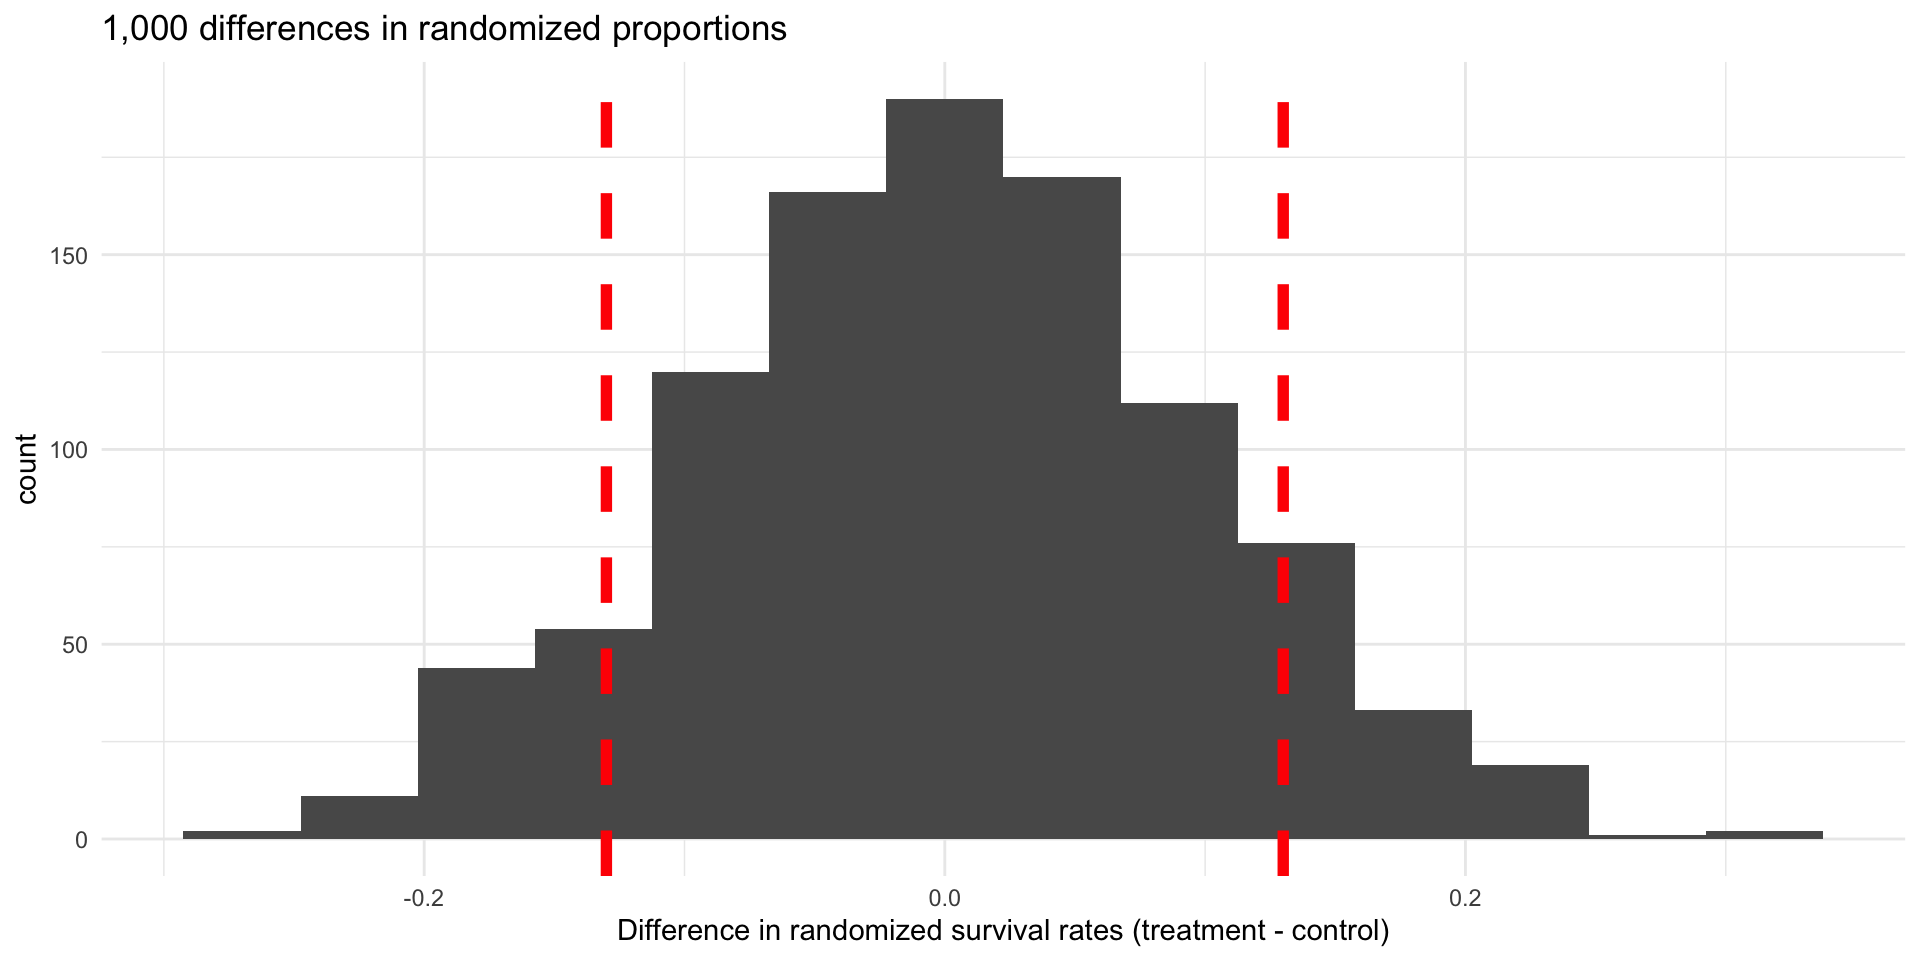
Difference in proportions of “survived”: \[\hat{p}_T-\hat{p}_C=\frac{14}{40}-\frac{11}{50}=0.13\]
Hypothesis Test Using Random Permutation
- 1,000 random permutations simulating true null hypothesis
- Values of response (outcome) shuffled each time
Mathematical Model for Difference in Proportions
Sampling distribution of \(\hat{p}_1-\hat{p}_2\)
The sampling distribution of \(\hat{p}_1-\hat{p}_2\) based on samples of size \(n_1\) and \(n_2\) and population proportions \(p_1\) and \(p_2\) will be approximately normal with mean \(p_1-p_2\) and standard error \[SE(\hat{p}_1-\hat{p}_2)=\sqrt{\frac{p_1(1-p_1)}{n_1}+\frac{p_2(1-p_2)}{n_2}}\]
if the following technical conditions are met:
- Data are independent within and between the two groups (e.g., observations from two independent random samples or from a randomized experiment)
- (success-failure condition) At least 10 expected successes and at least 10 expected failures in each group.
Hypothesis Test Using Normal Approximation
- Under the null hypothesis \(p_1=p_2\)
- We use the pooled proportion of successes, \(\hat{p}_{pool}\) to approximate this common proportion \[\hat{p}_{pool}=\frac{number\, of\, successes}{number\, of\, cases}=\frac{\hat{p}_1n_1+\hat{p}_2n_2}{n_1+n_2}\]
- In the CPR example 25 survived out of 90 total cases, so \(\hat{p}_{pool}=25/90=0.278\)
Checking Conditions for Hypothesis Test
- The expected numbers of successes and failures in group 1 are \(n_1\hat{p}_{pool}\) and \(n_1(1-\hat{p}_{pool})\)
- In group 2 they are \(n_2\hat{p}_{pool}\) and \(n_2(1-\hat{p}_{pool})\)
In the CPR example we expect
- Treatment group
- \(0.278\cdot40=11.1\) successes
- \((1-0.278)\cdot40=28.9\) failures
- Control group
- \(0.278\cdot50=13.9\) successes
- \((1-0.278)\cdot50=36.1\) failures
Since there are at least 10 expected successes and failures in each group a normal approximation of the null distribution is appropriate
SE for Hypothesis Test Using Normal Approximation
- We also use the pooled proportion to approximate the SE \[\begin{array}{rcl}SE(\hat{p}_1-\hat{p}_2) & \approx & \sqrt{\frac{\hat{p}_{pool}(1-\hat{p}_{pool})}{n_1}+\frac{\hat{p}_{pool}(1-\hat{p}_{pool})}{n_2}}\\ & = & \sqrt{\hat{p}_{pool}(1-\hat{p}_{pool})\left(\frac{1}{n_1}+\frac{1}{n_2}\right)}\end{array}\]
- For the CPR study \[SE\approx \sqrt{0.278\cdot(1-0.278)\left(\frac{1}{40}+\frac{1}{50}\right)}=0.095\]
Z Score for Two Proportions
- The hypothesis test using a normal approximation uses the \(Z\) score as the test statistic \[Z = \frac{(\hat{p}_1-\hat{p}_2) - 0}{\sqrt{\hat{p}_{pool}(1-\hat{p}_{pool})\left(\frac{1}{n_1}+\frac{1}{n_2}\right)}}\]
- Note that the denominator is the SE estimate we saw in the previous slide
- When the conditions are met, \(Z\) will have a standard normal distribution (\(N(0,1)\))
For the CPR example the Z score is \[Z=\frac{(\hat{p}_T-\hat{p}_C)-0}{SE}=\frac{0.13}{0.095}=1.37\]
P-value
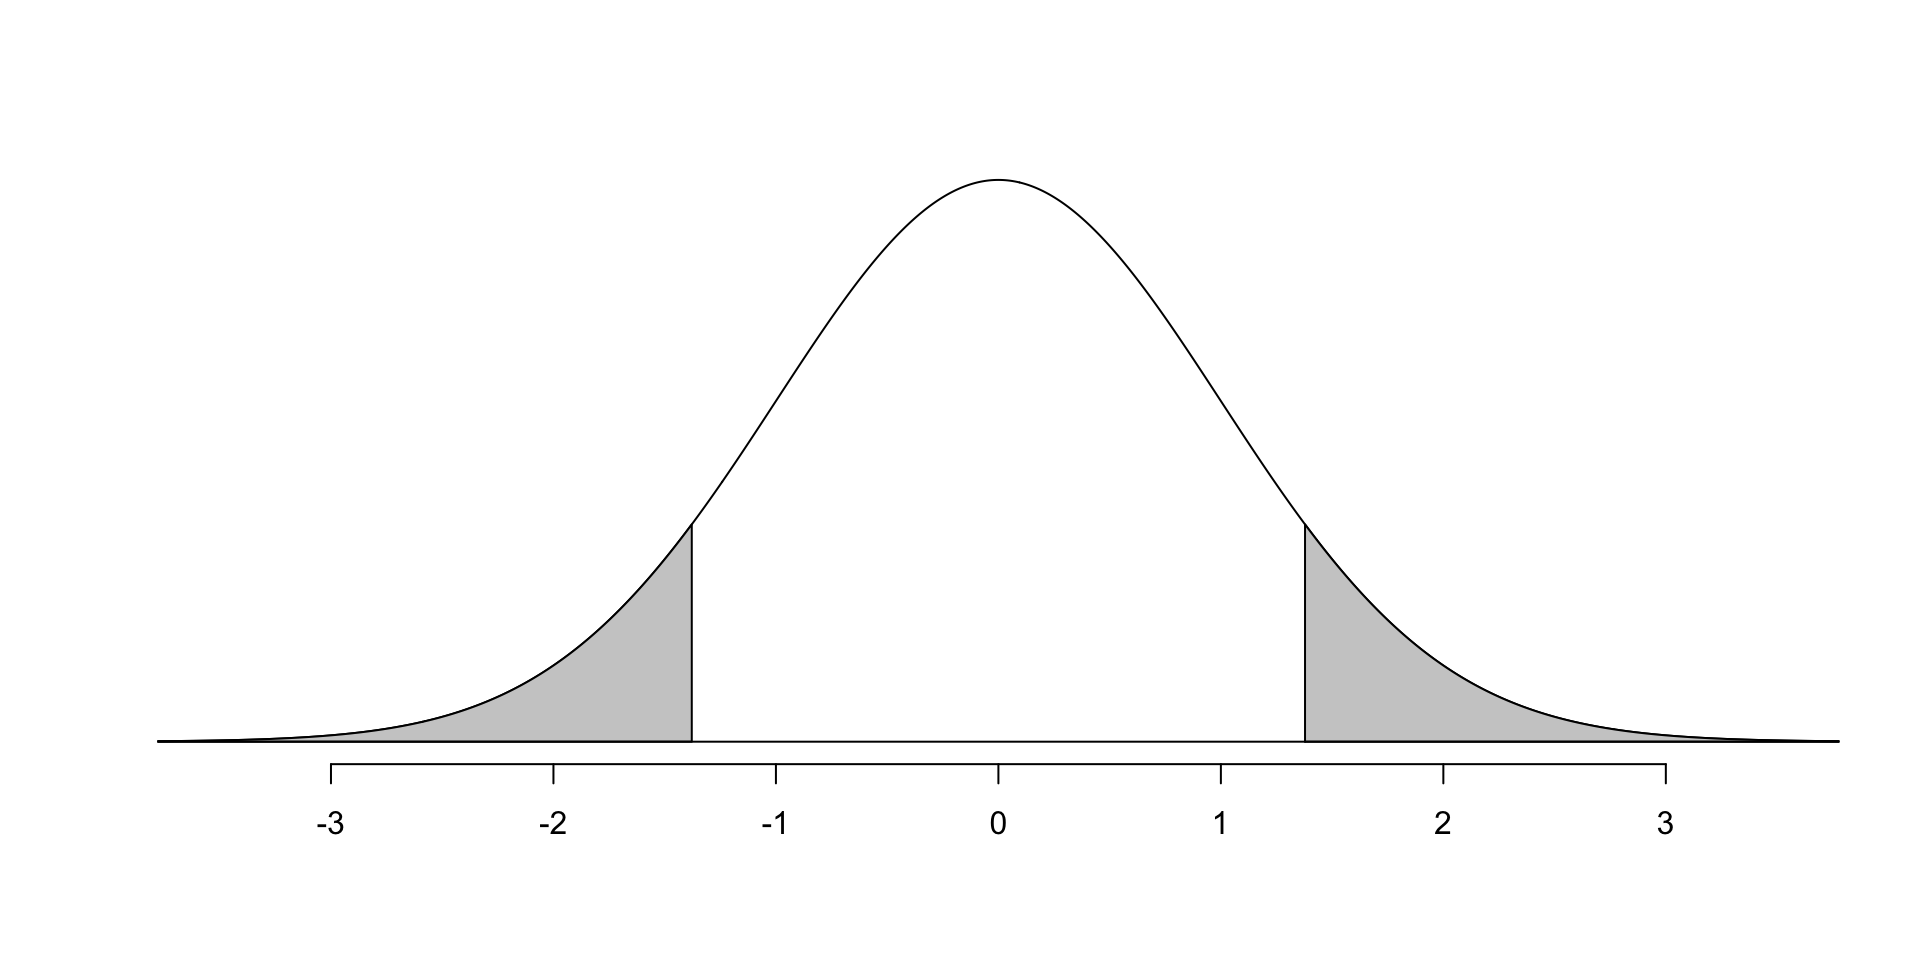
Standard normal curve with shaded area corresponding to p-value
The 2-sided p-value is the area under the density curve for \(N(0,1)\) that is more extreme than the observed difference (\(\leq-1.37\) or \(\geq1.37\))
Compare this p-value (0.171) to the one we calculated using random permutation (0.166)
Bootstrap Percentile Confidence Interval
- We can calculate a bootstrap percentile 95% confidence interval in much the same way that we did for a single proportion in Ch 12
- We think about the two samples (groups) as being our best approximation of the population and resample with replacement (bootstrap) from each group (\(n_1\) from group 1, \(n_2\) from group 2)
- The bootstrap proportions \(\hat{p}_{1,boot}\) and \(\hat{p}_{2,boot}\) will tend to be centered on \(\hat{p}_1\) and \(\hat{p}_2\) but will vary between replicates
- Calculate difference in bootstrap proportions \(\hat{p}_{1,boot}-\hat{p}_{2,boot}\) for each of a large number of replicates (at least 1,000)
- 95% CI is given by 2.5% to 97.5% percentiles
Let’s compute 1,000 differences in bootstrapped proportions using the CPR data.
The 95% bootstrap percentile confidence interval for the difference in survival rates (treatment - control) is between -0.055 and 0.313.
Bootstrap SE Confidence Interval
- Another way to compute a confidence interval is to use the differences in bootstrapped proportions to estimate the standard error
- For the CPR data this gives us the estimate SE \(\approx\) 0.0944
- This gives us a 95% Bootstrap SE Confidence Interval of \[0.13\pm 1.96\cdot 0.0944\]
- Thus, the 95% confidence interval is between -0.055 and 0.315
Confidence Interval Using Normal Approximation
- We can also use a normal approximation to calculate a confidence interval if the technical conditions are met
- In this case, we use \(\hat{p}_1\) and \(\hat{p}_2\) as the best approximations of \(p_1\) and \(p_2\)
Checking Conditions for Using Normal Approximation for CI
- In this case, the expected numbers of successes and failures in each group are the same as the counts of successes and failures in the samples
- The CPR data satisfy the success-failure condition
SE for Using Normal Approximation for CI
- The standard error approximation is \[SE\approx\sqrt{\frac{\hat{p}_1(1-\hat{p}_1)}{n_1}+\frac{\hat{p}_2(1-\hat{p}_2)}{n_2}}\]
- For the CPR study \[SE\approx\sqrt{\frac{0.35\cdot(1-0.35)}{40}+\frac{0.22\cdot(1-0.22)}{50}}=0.0955\]
95% Confidence Interval
- Using the normal approximation, the 95% confidence interval for the difference in survival rates is \[0.13\pm 1.96\cdot 0.0955\]
- Thus, the 95% confidence interval is between -0.057 and 0.317
Comparison of 95% Confidence Intervals
| Type | Interval |
|---|---|
| Bootstrap Percentile | (-0.055, 0.313) |
| Bootstrap SE | (-0.055, 0.315) |
| Normal Approximation | (-0.057, 0.317) |