Math 115 Test 2 Practice Exercises
1. A 99% confidence interval is constructed for a population mean. Compared to a 95% confidence interval using the same data, the 99% interval would be: Circle one.
Narrower because we need more precision for higher confidence
Wider because we need a larger range to be more confident
The same width because both use the same data
Cannot be determined without knowing the sample size
2. A 95% confidence interval for a population mean is (42, 58). Which of the following statements is TRUE? Circle all that apply.
The sample mean is 50
There is a 95% probability that the true mean is between 42 and 58
We are 95% confident that the true mean is between 42 and 58
95% of all sample means fall between 42 and 58
3. A movie theater surveys 180 patrons and finds that 99 prefer watching movies in 3D. A bootstrap 95% confidence interval for the true proportion who prefer 3D is (0.48, 0.62).
Based on this confidence interval, would you reject \(H_0: p = 0.5\) in favor of \(H_A: p \neq 0.5\) at the \(\alpha = 0.05\) significance level? Circle one.
Yes, reject \(H_0\) because 0.5 is not in the confidence interval
Yes, reject \(H_0\) because 0.5 is in the confidence interval
No, fail to reject \(H_0\) because 0.5 is not in the confidence interval
No, fail to reject \(H_0\) because 0.5 is in the confidence interval
4. A psychologist wants to study stress levels among college students. She stands outside the campus coffee shop during finals week and surveys the first 50 students who walk by and agree to participate.
(a) What type of sampling method is this? Circle one.
- Simple random sampling
- Convenience sampling
(b) Can her findings be generalized to all college students at her university? Circle one.
- Yes, because she collected a sample of students
- Yes, because 50 is a reasonable sample size
- No, because the sample may not be representative of all students at the university
- No, because stress levels vary by student
5. The heights of adult women are normally distributed with mean \(\mu\) = 64 inches and standard deviation \(\sigma\) = 3 inches.
(a) What percentage of adult women are between 61 and 67 inches tall?
Answer: _________%
Answer:
_________%
6. A factory manager inspects 80 products and finds 6 with defects. She wants to test whether the defect rate is different from 10%.
Is the success-failure condition met for using the normal model? Circle one.
Yes, because the expected numbers of successes and failures are both at least 10
Yes, because the sample size of 80 is large enough
No, because expected successes is less than 10
No, because the observed number of defects is less than 10
7. Which of the following would make a confidence interval WIDER? Circle all that apply.
Increasing the sample size
Decreasing the sample size
Increasing the confidence level from 95% to 99%
Decreasing the confidence level from 95% to 90%
8. A political analyst tests whether a candidate has majority support. In a sample of 150 likely voters, 82 support the candidate. She conducts a two-sided test: \(H_0: p = 0.5\) vs \(H_A: p \neq 0.5\).
The Z-score is 1.14 and the area to the right of Z = 1.14 is 0.126.
(a) Calculate the two-sided p-value. (Round to three decimal places.)
Answer: _________
(b) At \(\alpha = 0.05\), what is the conclusion? Circle one.
Reject \(H_0\); there is convincing evidence that the proportion is different from 0.5
Fail to reject \(H_0\); there is not convincing evidence that the proportion is different from 0.5
9. A medical researcher is testing whether a new screening test can detect a disease. The null hypothesis is that the test cannot detect the disease (no better than random chance).
(a) What would a Type I error mean in this context? Circle one.
- Concluding the test can detect the disease when it actually can
- Concluding the test can detect the disease when it actually cannot
- Concluding the test cannot detect the disease when it actually can
- Concluding the test cannot detect the disease when it actually cannot
(b) What would a Type II error mean in this context? Circle one.
- Concluding the test can detect the disease when it actually can
- Concluding the test can detect the disease when it actually cannot
- Concluding the test cannot detect the disease when it actually can
- Concluding the test cannot detect the disease when it actually cannot
10. A researcher reports: “The average GPA of students at State University is 3.2.” This value is a: Circle one.
Parameter, because it describes the entire population of State University students
Statistic, because it was calculated from a sample of students
Parameter if it was calculated from all students, or a statistic if from a sample
Neither a parameter nor a statistic
11. Determine whether each statement about confidence intervals is TRUE or FALSE. Circle one for each.
(a) Increasing the sample size will make a confidence interval narrower. True / False
(b) A 99% confidence interval is narrower than a 95% confidence interval. True / False
(c) If a 95% CI for a proportion is (0.52, 0.68), then 0.50 is a plausible value for the population proportion. True / False
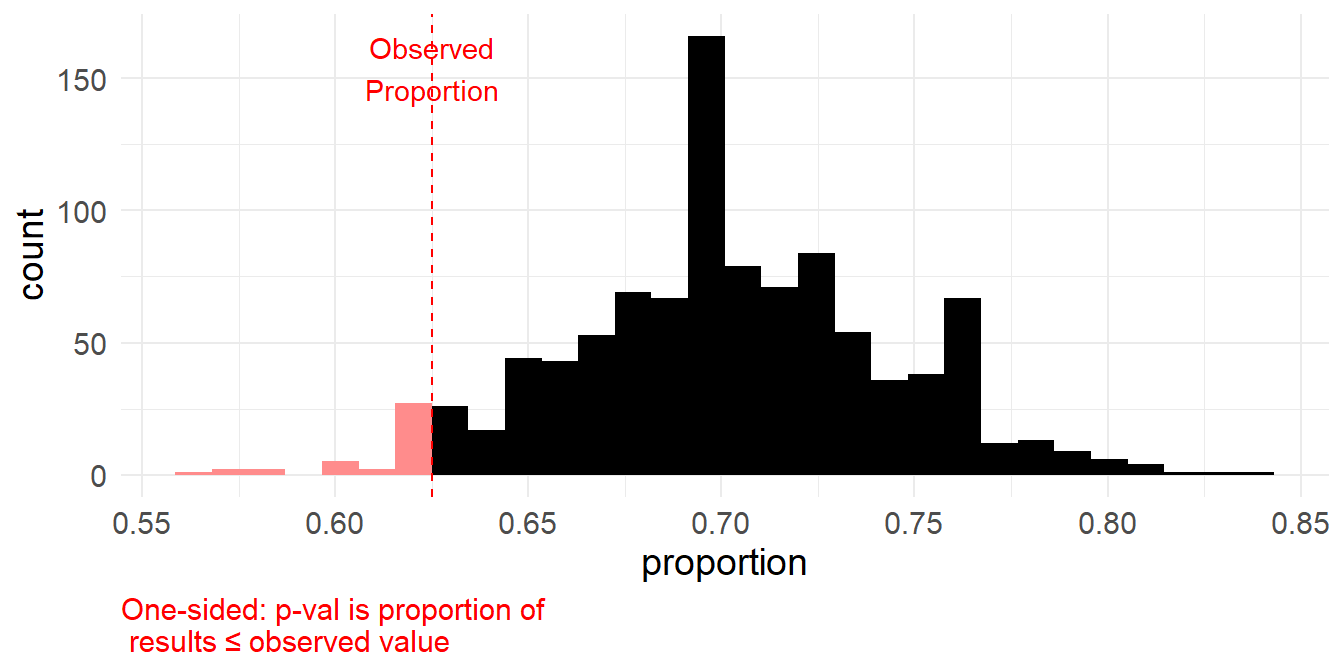
12. A restaurant chain claims that 70% of customers are satisfied with their service. A regional manager suspects the true satisfaction rate in her region is lower than 70%. She surveys a random sample of 120 customers and finds that 75 report being satisfied.
Below is a null distribution showing 1000 simulated proportions under the assumption that the true satisfaction rate is 70%.
Use this histogram and the information above to answer the following questions.
(a) What is the parameter of interest in this study? Circle one.
The proportion of the 120 sampled customers who reported being satisfied
The true proportion of all customers in this region who are satisfied with service
The 70% satisfaction rate claimed by the restaurant chain
The number of satisfied customers in the sample
(b) Which pair of hypotheses is appropriate for this research question? Circle one.
\(H_0: \hat{p} = 0.70\) vs. \(H_A: \hat{p} > 0.70\)
\(H_0: p = 0.70\) vs. \(H_A: p < 0.70\)
\(H_0: \hat{p} = 0.70\) vs. \(H_A: \hat{p} < 0.70\)
\(H_0: p = 0.70\) vs. \(H_A: p > 0.70\)
(c) Calculate the sample proportion \(\hat{p}\) of customers in the sample who reported being satisfied. (Round to two decimal places.)
Answer: _________
(d) Using the histogram, estimate the p-value for this hypothesis test. (Round to three decimal places.)
Answer: _________
(e) Which of the following correctly interprets the p-value in the context of this problem? Circle one.
The probability that the true satisfaction rate is 70%
The probability that the true satisfaction rate is less than 70%
The probability of observing a sample proportion of \(\hat{p}\) or lower, assuming the true satisfaction rate is 70%
The probability of observing a sample proportion of exactly \(\hat{p}\), assuming the true satisfaction rate is less than 70%
(f) Using a significance level of \(\alpha = 0.05\), what is the appropriate decision for this hypothesis test? Circle one.
Reject \(H_0\)
Fail to reject \(H_0\)
Accept \(H_0\)
(g) Based on your decision in part (f), which conclusion is appropriate? Circle one.
There is convincing evidence that the true satisfaction rate is less than 70%.
There is not enough evidence to conclude that the true satisfaction rate is less than 70%.
We have proved that the true satisfaction rate is exactly 70%.
There is convincing evidence that the true satisfaction rate is greater than 70%.
13. A dentist wants to estimate the proportion of patients who floss daily. She surveys a random sample of 80 patients and finds that 52 report flossing daily.
Below is a bootstrap distribution showing 1000 bootstrap proportions based on resampling from the original sample with replacement.
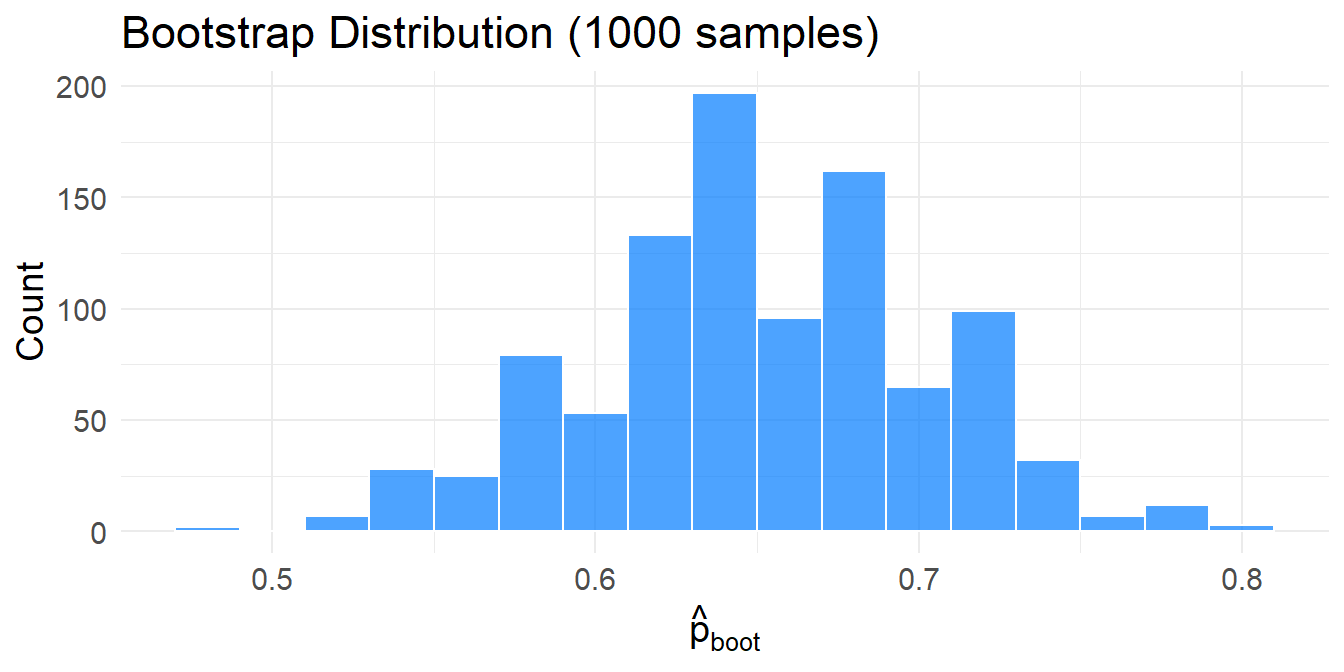
Use this histogram and the information above to answer the following questions.
(a) What is the parameter of interest in this study? Circle one.
The proportion of the 80 sampled patients who report flossing daily
The 52 patients in the sample who floss daily
The true proportion of all patients who floss daily
The average number of times patients floss per week
(b) Calculate the sample proportion \(\hat{p}\) of patients in the sample who report flossing daily. (Round to two decimal places.)
Answer: _________
(c) To construct a 95% confidence interval, which percentiles of the bootstrap distribution should be used? Circle one.
5th and 95th percentiles
2.5th and 97.5th percentiles
0.5th and 99.5th percentiles
25th and 75th percentiles
(d) Using the histogram, estimate the lower bound (2.5th percentile) of the 95% confidence interval. (Round to two decimal places.)
Answer: _________
(e) Using the histogram, estimate the upper bound (97.5th percentile) of the 95% confidence interval. (Round to two decimal places.)
Answer: _________
(f) Which of the following is the correct interpretation of this 95% confidence interval? Circle one.
There is a 95% probability that the true proportion of patients who floss daily is in this interval.
95% of all patients floss daily.
We are 95% confident that the true proportion of all patients who floss daily is in this interval.
95% of samples would have a proportion of patients who floss daily between these two values.
(g) Based on your confidence interval, is 0.60 (60%) a plausible value for the true proportion of patients who floss daily? Circle one.
Yes, because 0.60 is inside the confidence interval
No, because 0.60 is outside the confidence interval
Yes, because 0.60 is close to our sample proportion
No, because we cannot make claims about specific values from a confidence interval
14. A fitness app company claims that 50% of users complete their daily workout goal. A product manager believes the true completion rate is higher than 50%. She analyzes data from a random sample of 200 users and finds that 120 completed their daily goal.
Use the normal model and the 68-95-99.7 rule to answer the following questions.
(a) What are the null and alternative hypotheses? Circle one.
\(H_0: p = 0.50\) vs. \(H_A: p < 0.50\)
\(H_0: p = 0.50\) vs. \(H_A: p > 0.50\)
\(H_0: p = 0.50\) vs. \(H_A: p \neq 0.50\)
\(H_0: \hat{p} = 0.50\) vs. \(H_A: \hat{p} > 0.50\)
(b) Calculate the sample proportion \(\hat{p}\). (Round to two decimal places.)
Answer: _________
(c) Calculate the standard error using the null hypothesis value \(p_0 = 0.50\). (Round to two decimal places.)
Answer: _________
(d) Calculate the Z-score. (Round to two decimal places.)
Answer: _________
(e) The Z-score tells us that the sample proportion is how many standard errors above the null hypothesis value? Circle one.
- About 1 standard error above
- About 2 standard errors above
- About 3 standard errors above
- Less than 1 standard error above
(f) Using the 68-95-99.7 rule, approximately what percentage of the normal distribution is above Z = 3? Circle one.
- 16%
- 2.5%
- 0.15%
- 5%
(g) Based on your answer to part (f), is the one-sided p-value less than \(\alpha = 0.05\)? Circle one.
- Yes
- No
(h) What is the appropriate conclusion? Circle one.
Reject \(H_0\). There is convincing evidence that more than 50% of users complete their daily goal.
Reject \(H_0\). There is convincing evidence that exactly 60% of users complete their daily goal.
Fail to reject \(H_0\). There is not convincing evidence that more than 50% of users complete their daily goal.
Fail to reject \(H_0\). There is convincing evidence that 50% of users complete their daily goal.
15. A school district wants to estimate the proportion of parents who support implementing a four-day school week. They survey a random sample of 250 parents and find that 140 support the proposal.
Use the normal model to construct a 95% confidence interval for the true proportion of parents who support the four-day school week. Use \(z^* = 1.96\) for the multiplier.
(a) Calculate the sample proportion \(\hat{p}\). (Round to two decimal places.)
Answer: _________
(b) Check the success-failure condition. Are both the number of successes and the number of failures at least 10? Circle one.
- Yes
- No
(c) Calculate the standard error. Use the formula \(SE = \sqrt{\frac{\hat{p}(1-\hat{p})}{n}}\). (Round to three decimal places.)
Answer: _________
(d) Calculate the margin of error using \(z^* = 1.96\). (Round to three decimal places.) Hint: margin of error \(= z^* \times SE\)
Answer: _________
(e) Calculate the lower bound of the 95% confidence interval. (Round to two decimal places.)
Answer: _________
(f) Calculate the upper bound of the 95% confidence interval. (Round to two decimal places.)
Answer: _________
(g) Which of the following is the correct interpretation of this confidence interval? Circle one.
There is a 95% probability that the true proportion of parents who support the four-day week is within the interval.
We are 95% confident that the true proportion of all parents who support the four-day school week is within the interval.
95% of all samples would have a proportion of parents supporting the four-day week within the interval.
Exactly 95% of parents have support levels within the interval.
(h) Based on this confidence interval, is there convincing evidence that a majority (more than 50%) of parents support the four-day school week? Circle one.
Yes, because the entire confidence interval is above 0.50
Yes, because the sample proportion 0.56 is greater than 0.50
No, because the confidence interval contains 0.50
No, because we cannot draw conclusions about specific values from a confidence interval
16. For each study described below, determine whether it is an experiment or an observational study. Circle one for each.
(a) A hospital randomly selects 60 patients with surgical wounds from its patient records and randomly assigns them to receive either a new antibacterial dressing or a standard dressing, then records healing time.
- Experiment
- Observational study
(b) A researcher goes to a local gym and surveys 200 members who are willing to participate about their supplement use and records whether each member reported an injury in the past year.
- Experiment
- Observational study
(c) A teacher asks for student volunteers and randomly assigns half to study with flashcards and half to study with practice problems, then compares exam scores.
- Experiment
- Observational study
17. For each of the studies described in Problem 1, answer the following questions.
(a) Can the results be generalized to a broader population? Circle one for each.
Study (a) — Hospital wound care: Yes / No
Study (b) — Gym supplement survey: Yes / No
Study (c) — Student flashcards vs. practice: Yes / No
(b) Can we conclude causation from each study? Circle one for each.
Study (a) — Hospital wound care: Yes / No
Study (b) — Gym supplement survey: Yes / No
Study (c) — Student flashcards vs. practice: Yes / No
18. A health researcher surveys 240 adults about their exercise habits and how frequently they get colds. The results are shown in the contingency table below.
| 2+ Colds/Year | <2 Colds/Year | Total | |
|---|---|---|---|
| Regular Exercise | 28 | 92 | 120 |
| Not Regular | 52 | 68 | 120 |
| Total | 80 | 160 | 240 |
(a) What proportion of adults who exercise regularly had 2 or more colds per year? (Round to three decimal places.)
Answer: _________
(b) What proportion of adults who do NOT exercise regularly had 2 or more colds per year? (Round to three decimal places.)
Answer: _________
(c) Based on your answers to (a) and (b), does there appear to be an association between exercise frequency and cold frequency? Briefly explain.
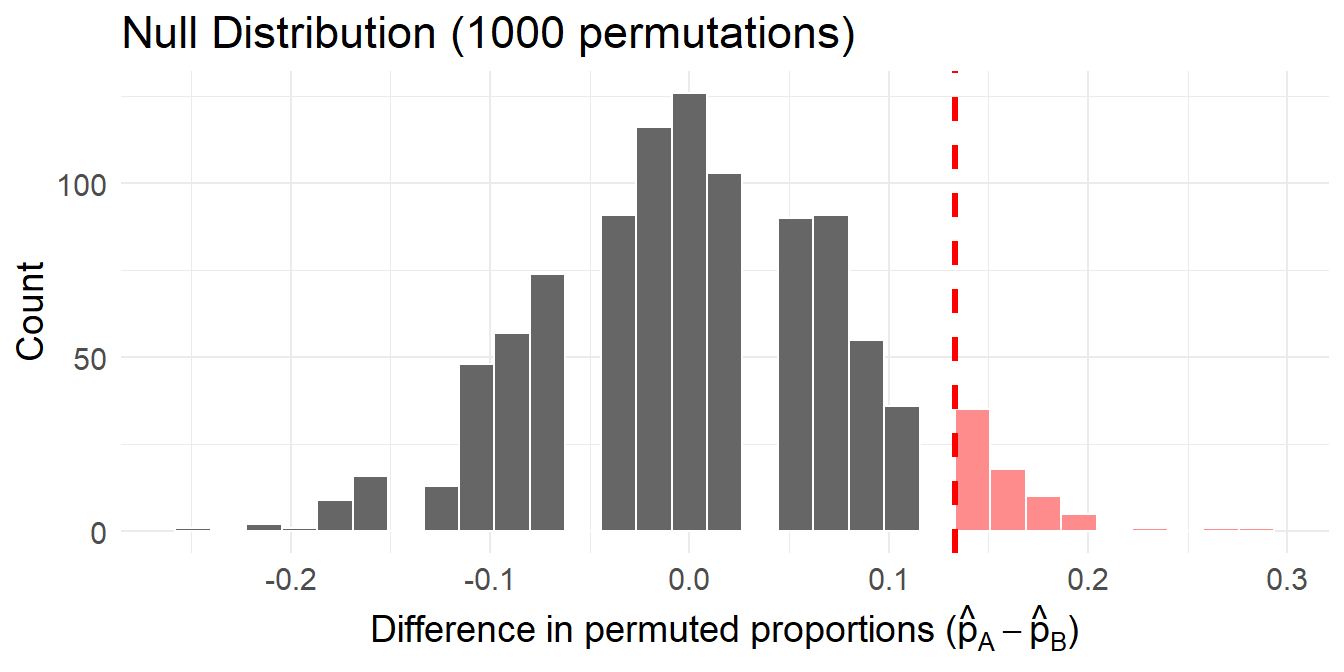
19. A university randomly assigns 180 students to one of two study methods for an introductory course: 90 students use Method A (active recall) and 90 use Method B (re-reading notes). At the end of the semester, the university records whether each student passed the final exam. The results are:
- Method A: 54 out of 90 passed
- Method B: 42 out of 90 passed
The researchers believe Method A leads to a higher pass rate. Below is a null distribution showing 1000 simulated differences in proportions (\(\hat{p}_A - \hat{p}_B\)) under the assumption that the two methods are equally effective. The dashed red line marks the observed difference. Values at or beyond the observed difference are highlighted.
Use the histogram and the information above to answer the following questions.
(a) Which pair of hypotheses is appropriate for this research question? Circle one.
\(H_0: p_A - p_B = 0\) vs. \(H_A: p_A - p_B > 0\)
\(H_0: p_A - p_B = 0\) vs. \(H_A: p_A - p_B \neq 0\)
\(H_0: \hat{p}_A - \hat{p}_B = 0\) vs. \(H_A: \hat{p}_A - \hat{p}_B > 0\)
\(H_0: \hat{p}_A - \hat{p}_B = 0\) vs. \(H_A: \hat{p}_A - \hat{p}_B \neq 0\)
(b) What is the observed difference in sample proportions (\(\hat{p}_A - \hat{p}_B\))? (Round to three decimal places.)
Answer: _________
(c) Using the histogram, estimate the p-value for this hypothesis test. (Round to three decimal places.)
Answer: _________
(d) Using a significance level of \(\alpha = 0.05\), what is the appropriate decision? Circle one.
- Reject \(H_0\)
- Fail to reject \(H_0\)
- Accept \(H_0\)
(e) Which conclusion is appropriate? Circle one.
There is convincing evidence that Method A causes a higher pass rate than Method B.
There is not enough evidence to conclude that Method A leads to a higher pass rate than Method B.
There is convincing evidence of an association between study method and pass rate, but we cannot conclude causation.
We have proved that the two methods are equally effective.
20. Determine whether each statement is TRUE or FALSE. Circle one for each.
(a) Permutation tests simulate the null hypothesis by shuffling the response values and recalculating the statistic many times.
True / False
(b) A bootstrap confidence interval requires knowing the population parameter in order to construct it.
True / False
(c) If a 95% bootstrap confidence interval for \(p_1 - p_2\) contains 0, we would fail to reject \(H_0: p_1 - p_2 = 0\) at the \(\alpha = 0.05\) significance level.
True / False
21. A researcher uses a bootstrap method to construct a 95% confidence interval for the difference in two population proportions (\(p_1 - p_2\)) and obtains the interval (0.02, 0.14). Which of the following is the best interpretation? Circle one.
There is a 95% probability that \(p_1 - p_2\) is between 0.02 and 0.14.
We are 95% confident that the true difference in population proportions (\(p_1 - p_2\)) is between 0.02 and 0.14.
If we repeated this study, 95% of the time the sample difference in proportions would be between 0.02 and 0.14.
Because the interval does not contain 0, we are 95% confident that \(p_1 = p_2\).
22. A medical clinic wants to know whether the type of appointment reminder affects whether patients show up. The clinic randomly assigns 240 patients: 120 receive an email reminder and 120 receive a text reminder. The results are shown below.
| Showed Up | Did Not Show | Total | |
|---|---|---|---|
| Email Reminder | 82 | 38 | 120 |
| Text Reminder | 70 | 50 | 120 |
| Total | 152 | 88 | 240 |
Conduct a two-sided hypothesis test at \(\alpha = 0.05\) to determine whether there is a difference in show-up rates between the two reminder types. Let \(\hat{p}_E\) be the proportion who showed up in the email group and \(\hat{p}_T\) be the proportion who showed up in the text group.
(a) Which pair of hypotheses is appropriate? Circle one.
\(H_0: p_E - p_T = 0\) vs. \(H_A: p_E - p_T \neq 0\)
\(H_0: p_E - p_T = 0\) vs. \(H_A: p_E - p_T > 0\)
\(H_0: \hat{p}_E - \hat{p}_T = 0\) vs. \(H_A: \hat{p}_E - \hat{p}_T \neq 0\)
\(H_0: \hat{p}_E - \hat{p}_T = 0\) vs. \(H_A: \hat{p}_E - \hat{p}_T > 0\)
(b) Calculate the pooled proportion. (Round to three decimal places.)
Answer: _________
(c) What is the observed difference in sample proportions (\(\hat{p}_E - \hat{p}_T\))? (Round to three decimal places.)
Answer: _________
(d) Calculate the standard error. (Round to four decimal places.)
Answer: _________
(e) Calculate the Z-statistic. (Round to two decimal places.)
Answer: _________
(f) Use Jamovi to find the p-value. (Round to three decimal places.)
Answer: _________
(g) At \(\alpha = 0.05\), what is the appropriate decision? Circle one.
Reject \(H_0\); there is convincing evidence of a difference in show-up rates.
Fail to reject \(H_0\); there is not convincing evidence of a difference in show-up rates.
Accept \(H_0\); there is convincing evidence that the show-up rates are the same.
23. A city wants to compare composting rates between urban and suburban households. Random samples of 200 urban and 200 suburban households are surveyed. The results are shown below.
| Compost | Do Not Compost | Total | |
|---|---|---|---|
| Urban | 96 | 104 | 200 |
| Suburban | 68 | 132 | 200 |
| Total | 164 | 236 | 400 |
Construct a 95% confidence interval for the difference in population proportions (\(p_U - p_S\)).
(a) What is the observed difference in sample proportions (\(\hat{p}_U - \hat{p}_S\))? (Round to three decimal places.)
Answer: _________
(b) Calculate the standard error. (Round to four decimal places.)
Answer: _________
(c) What is \(z^*\) for a 95% confidence interval? Use Jamovi. (Round to three decimal places.)
Answer: _________
(d) Calculate the lower bound of the 95% confidence interval. (Round to three decimal places.)
Answer: _________
(e) Calculate the upper bound of the 95% confidence interval. (Round to three decimal places.)
Answer: _________
24. When conducting a hypothesis test for the difference in two proportions, we use a pooled proportion to calculate the standard error. When constructing a confidence interval for the difference in two proportions, we use the separate (unpooled) sample proportions. Why? Circle one.
The pooled proportion gives a smaller standard error, which makes the test more likely to reject \(H_0\).
Under \(H_0\), we assume the two proportions are equal, so pooling gives our best estimate of that common proportion. For a CI, we are not assuming the proportions are equal, so we use the separate estimates.
The pooled proportion is always more accurate than the separate proportions.
There is no real reason — either method can be used for both the test and the CI.
25. A pizza delivery chain claims that their average delivery time is at most 30 minutes. A consumer group suspects it takes longer and collects a random sample of 25 deliveries, finding a sample mean of \(\bar{x}\) = 33.2 minutes with a sample standard deviation of \(s\) = 5.5 minutes. Assume conditions for inference with a t-distribution are met.
(a) Which pair of hypotheses is appropriate? Circle one.
\(H_0: \mu = 30\) vs. \(H_A: \mu > 30\)
\(H_0: \mu = 30\) vs. \(H_A: \mu < 30\)
\(H_0: \mu = 30\) vs. \(H_A: \mu \neq 30\)
\(H_0: \bar{x} = 30\) vs. \(H_A: \bar{x} > 30\)
(b) Calculate the standard error. (Round to one decimal place.)
Answer: _________
(c) What are the degrees of freedom?
Answer: _________
(d) Calculate the T-statistic. (Round to two decimal places.)
Answer: _________
(e) Use Jamovi to find the p-value. (Round to three decimal places.)
Answer: _________
(f) At \(\alpha = 0.05\), what is the appropriate decision? Circle one.
Reject \(H_0\); there is convincing evidence that the mean delivery time is greater than 30 minutes.
Fail to reject \(H_0\); there is not convincing evidence that the mean delivery time is greater than 30 minutes.
Accept \(H_0\); there is convincing evidence that the mean delivery time is at most 30 minutes.
26. A medical clinic takes a random sample of patient visits and computes a 95% confidence interval for the true mean wait time: (18.5, 24.3) minutes.
(a) Which of the following is the correct interpretation of this confidence interval? Circle one.
If we took many random samples and computed a 95% confidence interval from each, about 95% of those intervals would contain the true mean wait time.
95% of all patients at this clinic wait between 18.5 and 24.3 minutes.
There is a 95% probability that the true mean wait time is between 18.5 and 24.3 minutes.
If we took many samples, 95% of sample means would fall between 18.5 and 24.3 minutes.
(b) The clinic advertises that the average wait time is at most 15 minutes. Based on the confidence interval, does the evidence dispute this claim? Circle one.
Yes — 15 is not in the confidence interval, so we have evidence the mean wait time is greater than 15 minutes.
No — 15 is in the confidence interval, so we do not have evidence to dispute the claim.
Yes — the sample mean is not 15, so we have evidence the mean differs from 15.
No — a confidence interval only estimates the mean and cannot be used to evaluate claims.
27. For each change described below (while keeping everything else the same), what happens to the width of a confidence interval for a population mean? Circle one for each.
(a) The sample size is doubled.
- Wider
- Narrower
- Stays the same
(b) The confidence level is increased (e.g., from 90% to 99%).
- Wider
- Narrower
- Stays the same
(c) The sample standard deviation increases.
- Wider
- Narrower
- Stays the same
title: “Math 115 Practice Test 2 — Answer Key” format: html: toc: true toc-depth: 2 number-sections: true execute: echo: false warning: false message: false ————–
Answer Key
1
Answer: B
A 99% confidence interval must be wider than a 95% interval because we need a larger margin of error to achieve higher confidence.
2
Correct answers: A and C
A: The midpoint of the interval (42, 58) is the sample mean (42 + 58) / 2 = 50
C: Correct CI interpretation: we are 95% confident the population mean lies in the interval.
3
Bootstrap 95% CI: (0.48, 0.62)
Answer: D
Because 0.50 is inside the interval, we fail to reject H₀ at α = 0.05.
4
Convenience sampling
No, the sample may not represent all students.
Students surveyed near a coffee shop during finals week may have unusually high stress.
5
68%
2.5%
Explanation:
- 61–67 = μ ± 1σ → about 68%
- 70 = μ + 2σ → upper tail ≈ 2.5%
6
Expected successes under the null:
np₀ = 80(0.10) = 8
Answer: C
The success-failure condition requires ≥10 expected successes and failures.
7
Correct answers: B and C
- Decreasing sample size increases variability.
- Increasing confidence level increases the critical value.
Both make intervals wider.
8
Two-sided p-value:
p = 2(0.126) = 0.252
0.252
Fail to reject H₀
Because p > 0.05.
9
- Type I error
Concluding the test detects the disease when it actually cannot.
- Type II error
Concluding the test cannot detect the disease when it actually can.
10
Correct answer: C
It is a parameter if computed from the entire population, or a statistic if from a sample.
11
True
False
False
Explanation:
- Increasing sample size narrows intervals.
- Higher confidence makes intervals wider.
- Since 0.50 is outside (0.52, 0.68), it is not plausible.
12
- Parameter:
True proportion of customers satisfied in the region
- Hypotheses
H₀: p = 0.70
Hₐ: p < 0.70
p̂ = 75 / 120 = 0.625
Estimated p-value ≈ 0.037
Correct interpretation: iii
Since p < 0.05, reject H₀.
There is convincing evidence the satisfaction rate is below 70%.
13
- Parameter:
True proportion of patients who floss daily
p̂ = 52 / 80 = 0.65
Use 2.5% and 97.5% percentiles
Lower bound ≈ 0.55
Upper bound ≈ 0.75
Correct interpretation:
We are 95% confident the population proportion lies in the interval.
Yes.
0.60 is inside the interval, so it is plausible.
14
H₀: p = 0.50 Hₐ: p > 0.50
p̂ = 120 / 200 = 0.60
SE = sqrt(0.5×0.5 / 200) = 0.035
z = (0.60 − 0.50) / 0.035 ≈ 2.83
≈ 3 standard errors above
Area above z = 3 ≈ 0.15%
Yes, p-value < 0.05.
Reject H₀.
Evidence completion rate exceeds 50%.
15
p̂ = 140 / 250 = 0.56
Successes = 140 Failures = 110
Condition satisfied.
SE = sqrt(0.56×0.44 / 250) = 0.031
ME = 1.96 × 0.031 = 0.061
Lower bound
0.56 − 0.061 = 0.499
Upper bound
0.56 + 0.061 = 0.621
CI ≈ (0.50, 0.62)
Correct interpretation:
We are 95% confident the population proportion lies in the interval.
No.
Since 0.50 is inside the interval, a majority is not established.
16
Experiment
Observational study
Experiment
Experiments assign treatments; observational studies only observe existing behavior.
17
Generalization
Study A: Yes Study B: No Study C: No
Causation
Study A: Yes Study B: No Study C: Yes
Random sampling supports generalization. Random assignment supports causation.
18
28 / 120 = 0.233
52 / 120 = 0.433
Yes, there appears to be an association.
Adults who do not exercise regularly have a higher cold rate.
19
H₀: pA − pB = 0 Hₐ: pA − pB > 0
54/90 − 42/90 = 0.133
Estimated p-value ≈ 0.03
Reject H₀.
Evidence Method A increases pass rate.
20
True
False
True
21
Correct answer: B
We are 95% confident the difference in population proportions lies between 0.02 and 0.14.
22
H₀: pE − pT = 0 Hₐ: pE − pT ≠ 0
p_pool = 152 / 240 = 0.633
0.683 − 0.583 = 0.100
SE ≈ 0.062
z ≈ 1.61
p ≈ 0.107
Fail to reject H₀.
There is not convincing evidence of a difference.
23
0.48 − 0.34 = 0.14
SE ≈ 0.047
z* = 1.96
Lower bound ≈ 0.048
Upper bound ≈ 0.232
24
Correct answer: B
Pooling assumes the two population proportions are equal under H₀, which is appropriate for hypothesis testing.
Confidence intervals estimate the difference directly, so separate sample proportions are used.
25
H₀: μ = 30 Hₐ: μ > 30
SE = 5.5 / √25 = 1.1
df = 24
t = (33.2 − 30) / 1.1 ≈ 2.91
p ≈ 0.004
Reject H₀.
Evidence mean delivery time exceeds 30 minutes.
26
Correct interpretation:
If many samples were taken, 95% of intervals would contain the true mean.
Yes.
Since 15 is outside the interval, the claim of ≤15 minutes is not supported.
27
Narrower
Wider
Wider
Explanation:
- Larger sample size → smaller standard error
- Higher confidence level → wider interval
- Larger variability → wider interval