| Transportation Mode | Frequency |
|---|---|
| Bicycle | 46 |
| Car | 133 |
| Public Transit | 91 |
| Walking | 30 |
| Total | 300 |
Math 115 Test 1 Practice Exercises
1. A marketing researcher surveys 350 consumers about their shopping habits, recording each person’s household income (in dollars), number of online purchases per month, preferred payment method (credit card, debit card, cash, digital wallet), and whether they use a shopping rewards program (yes/no).
(a) What are the cases in this study? Select one.
The 4 variables measured
The 350 consumers surveyed
All consumers in the population
The marketing researcher
(b) Identify each variable as categorical or numerical. Select one for each.
Household income: Categorical / Numerical
Number of online purchases per month: Categorical / Numerical
Preferred payment method: Categorical / Numerical
Uses shopping rewards program: Categorical / Numerical
2. Classify each variable as nominal, ordinal, discrete, or continuous. Select one for each.
Eye color (blue, brown, green, hazel)
- Nominal
- Ordinal
- Discrete
- Continuous
Number of pets owned
- Nominal
- Ordinal
- Discrete
- Continuous
Distance traveled to work (in miles)
- Nominal
- Ordinal
- Discrete
- Continuous
Customer satisfaction rating (very dissatisfied, dissatisfied, neutral, satisfied, very satisfied)
- Nominal
- Ordinal
- Discrete
- Continuous
3. A survey of 300 employees at a large company asked about their primary mode of transportation to work. The results are shown below:
(a) What proportion of employees primarily use public transit? (Round to three decimal places.)
Answer: _________
(b) How many employees primarily bicycle to work?
Answer: _________
(c) What percentage of employees primarily drive a car? (Round to one decimal place.)
Answer: _________%
4. A meteorologist records the following 10 daily high temperatures (in degrees Fahrenheit) for a city: 58, 62, 64, 65, 66, 67, 68, 69, 70, 95.
(a) Calculate the mean. (Round to one decimal place.)
Answer: _________
(b) Calculate the median.
Answer: _________
(c) Which measure (mean or median) is larger? Select one.
- Mean
- Median
- They are equal
(d) Based on your answer to (c), is this distribution left-skewed, right-skewed, or symmetric? Select one.
- Left-skewed
- Right-skewed
- Symmetric
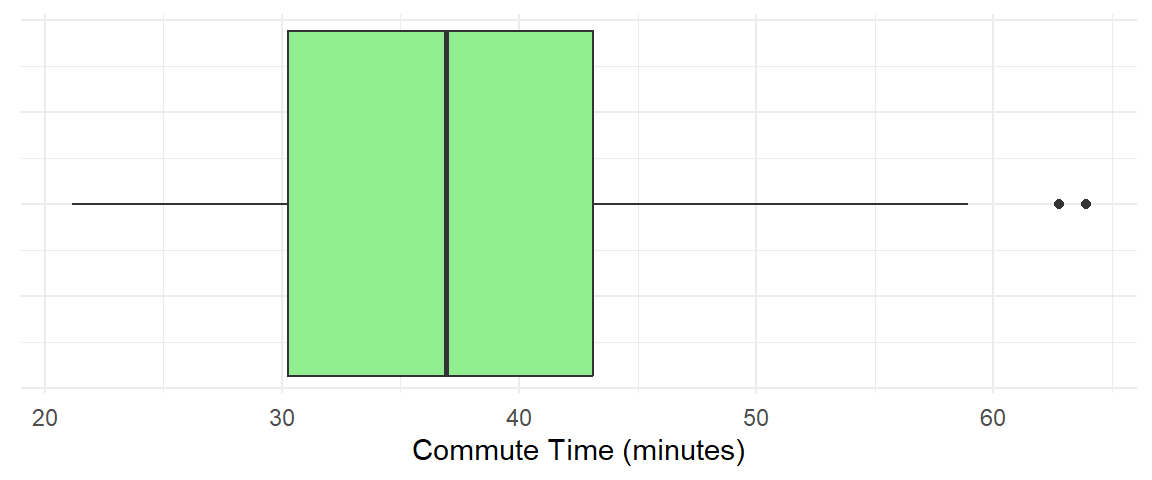
5. Based on the boxplot above:
(a) What is the approximate median commute time? (Round to one decimal place.)
Answer: _________
(b) What is the approximate IQR? (Round to one decimal place.)
Answer: _________
6. A researcher conducts a hypothesis test and obtains a p-value of 0.72. Which statement best describes this result? Select one.
There is strong evidence against the null hypothesis
There is moderate evidence against the null hypothesis
There is weak evidence against the null hypothesis
There is essentially no evidence against the null hypothesis
7. A researcher rejects the null hypothesis at the \(\alpha = 0.05\) significance level. Which of the following is a correct interpretation? Select one.
The null hypothesis has been proven false
The alternative hypothesis has been proven true
The data provide convincing evidence against the null hypothesis
The probability that the null hypothesis is true is less than 0.05
8. A 99% confidence interval is constructed for a population mean. Compared to a 95% confidence interval using the same data, the 99% interval would be: Select one.
Narrower because we need more precision for higher confidence
Wider because we need a larger range to be more confident
The same width because both use the same data
Cannot be determined without knowing the sample size
9. A 95% confidence interval for a population mean is (42, 58). Which of the following statements is TRUE? Select all that apply.
The sample mean is 50
There is a 95% probability that the true mean is between 42 and 58
We are 95% confident that the true mean is between 42 and 58
95% of all sample means fall between 42 and 58
10. A movie theater surveys 180 patrons and finds that 99 prefer watching movies in 3D. A bootstrap 95% confidence interval for the true proportion who prefer 3D is (0.48, 0.62).
Based on this confidence interval, would you reject \(H_0: p = 0.5\) in favor of \(H_A: p \neq 0.5\) at the \(\alpha = 0.05\) significance level? Select one.
Yes, reject \(H_0\) because 0.5 is not in the confidence interval
Yes, reject \(H_0\) because 0.5 is in the confidence interval
No, fail to reject \(H_0\) because 0.5 is not in the confidence interval
No, fail to reject \(H_0\) because 0.5 is in the confidence interval
11. A psychologist wants to study stress levels among college students. She stands outside the campus coffee shop during finals week and surveys the first 50 students who walk by and agree to participate.
(a) What type of sampling method is this? Select one.
- Simple random sampling
- Convenience sampling
(b) Can her findings be generalized to all college students at her university? Select one.
- Yes, because she collected a sample of students
- Yes, because 50 is a reasonable sample size
- No, because the sample may not be representative of all students at the university
- No, because stress levels vary by student
12. Which of the following would make a confidence interval WIDER? Select all that apply.
Increasing the sample size
Decreasing the sample size
Increasing the confidence level from 95% to 99%
Decreasing the confidence level from 95% to 90%
13. A researcher reports: “The average GPA of students at State University is 3.2.” This value is a: Select one.
Parameter, because it describes the entire population of State University students
Statistic, because it was calculated from a sample of students
Parameter if it was calculated from all students, or a statistic if from a sample
Neither a parameter nor a statistic
14. Determine whether each statement about confidence intervals is TRUE or FALSE. Select one for each.
(a) Increasing the sample size will make a confidence interval narrower. True / False
(b) A 99% confidence interval is narrower than a 95% confidence interval. True / False
(c) If a 95% CI for a proportion is (0.52, 0.68), then 0.50 is a plausible value for the population proportion. True / False
15. A restaurant chain claims that 70% of customers are satisfied with their service. A regional manager suspects the true satisfaction rate in her region is lower than 70%. She surveys a random sample of 120 customers and finds that 75 report being satisfied.
Below is a null distribution showing 1000 simulated proportions under the assumption that the true satisfaction rate is 70%.
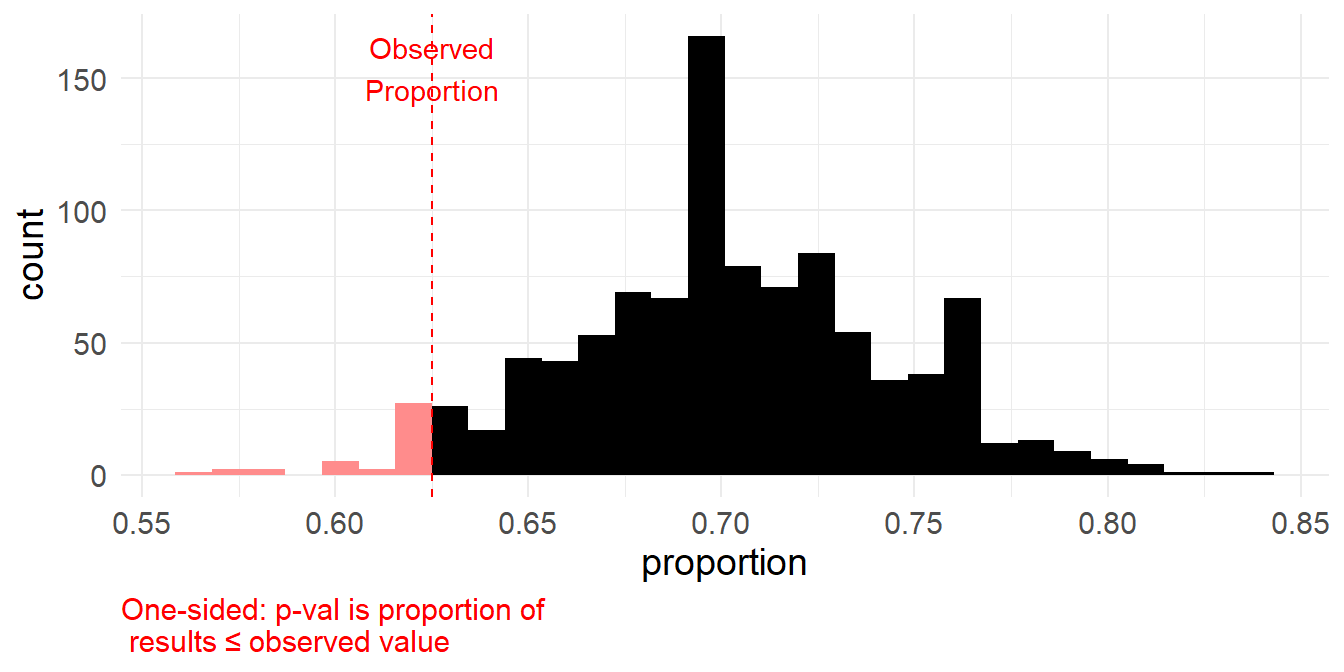
Use this histogram and the information above to answer the following questions.
(a) What is the parameter of interest in this study? Select one.
The proportion of the 120 sampled customers who reported being satisfied
The true proportion of all customers in this region who are satisfied with service
The 70% satisfaction rate claimed by the restaurant chain
The number of satisfied customers in the sample
(b) Which pair of hypotheses is appropriate for this research question? Select one.
\(H_0: \hat{p} = 0.70\) vs. \(H_A: \hat{p} > 0.70\)
\(H_0: p = 0.70\) vs. \(H_A: p < 0.70\)
\(H_0: \hat{p} = 0.70\) vs. \(H_A: \hat{p} < 0.70\)
\(H_0: p = 0.70\) vs. \(H_A: p > 0.70\)
(c) Calculate the sample proportion \(\hat{p}\) of customers in the sample who reported being satisfied. (Round to two decimal places.)
Answer: _________
(d) Using the histogram, estimate the p-value for this hypothesis test. (Round to three decimal places.)
Answer: _________
(e) Which of the following correctly interprets the p-value in the context of this problem? Select one.
The probability that the true satisfaction rate is 70%
The probability that the true satisfaction rate is less than 70%
The probability of observing a sample proportion of \(\hat{p}\) or lower, assuming the true satisfaction rate is 70%
The probability of observing a sample proportion of exactly \(\hat{p}\), assuming the true satisfaction rate is less than 70%
(f) Using a significance level of \(\alpha = 0.05\), what is the appropriate decision for this hypothesis test? Select one.
Reject \(H_0\)
Fail to reject \(H_0\)
Accept \(H_0\)
(g) Based on your decision in part (f), which conclusion is appropriate? Select one.
There is convincing evidence that the true satisfaction rate is less than 70%.
There is not enough evidence to conclude that the true satisfaction rate is less than 70%.
We have proved that the true satisfaction rate is exactly 70%.
There is convincing evidence that the true satisfaction rate is greater than 70%.
16. A dentist wants to estimate the proportion of patients who floss daily. She surveys a random sample of 80 patients and finds that 52 report flossing daily.
Below is a bootstrap distribution showing 1000 bootstrap proportions based on resampling from the original sample with replacement.
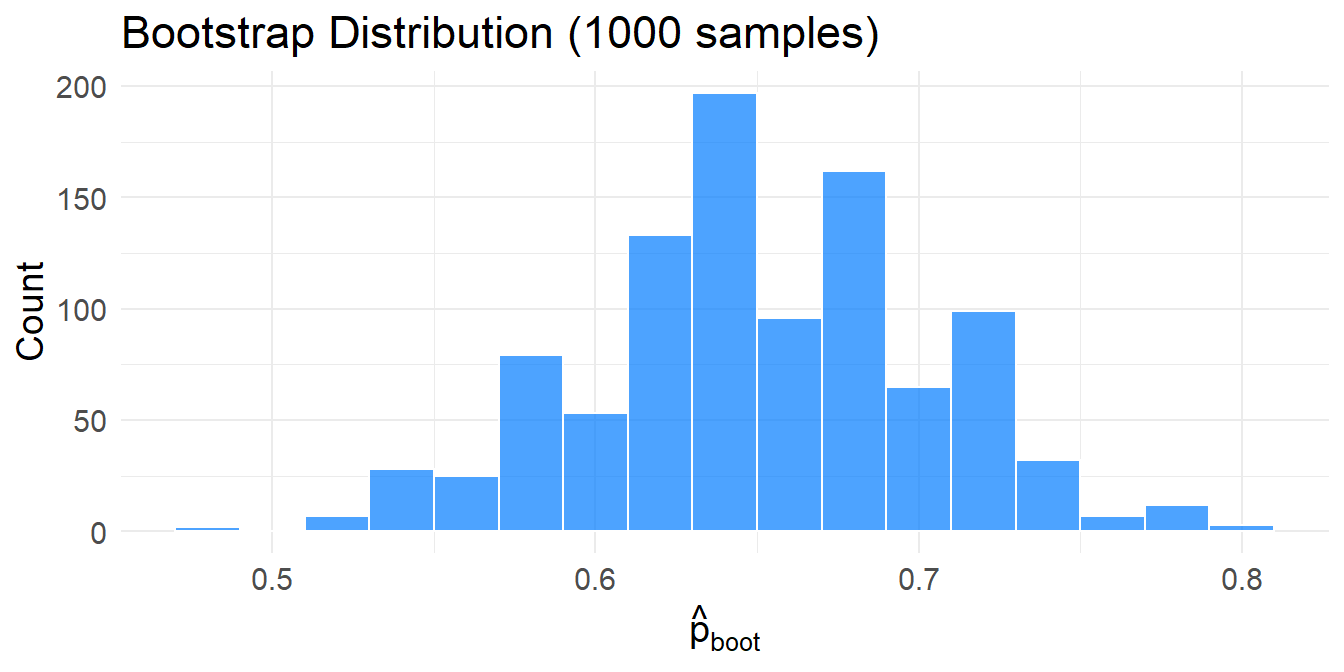
Use this histogram and the information above to answer the following questions.
(a) What is the parameter of interest in this study? Select one.
The proportion of the 80 sampled patients who report flossing daily
The 52 patients in the sample who floss daily
The true proportion of all patients who floss daily
The average number of times patients floss per week
(b) Calculate the sample proportion \(\hat{p}\) of patients in the sample who report flossing daily. (Round to two decimal places.)
Answer: _________
(c) To construct a 95% confidence interval, which percentiles of the bootstrap distribution should be used? Select one.
5th and 95th percentiles
2.5th and 97.5th percentiles
0.5th and 99.5th percentiles
25th and 75th percentiles
(d) Using the histogram, estimate the lower bound (2.5th percentile) of the 95% confidence interval. (Round to two decimal places.)
Answer: _________
(e) Using the histogram, estimate the upper bound (97.5th percentile) of the 95% confidence interval. (Round to two decimal places.)
Answer: _________
(f) Which of the following is the correct interpretation of this 95% confidence interval? Select one.
There is a 95% probability that the true proportion of patients who floss daily is in this interval.
95% of all patients floss daily.
We are 95% confident that the true proportion of all patients who floss daily is in this interval.
95% of samples would have a proportion of patients who floss daily between these two values.
(g) Based on your confidence interval, is 0.60 (60%) a plausible value for the true proportion of patients who floss daily? Select one.
Yes, because 0.60 is inside the confidence interval
No, because 0.60 is outside the confidence interval
Yes, because 0.60 is close to our sample proportion
No, because we cannot make claims about specific values from a confidence interval
Answer Key
1
(a) (ii) The 350 consumers surveyed
Brief explanation: Cases are the observational units (the individuals surveyed).
(b)
- Household income: Numerical
- Number of online purchases per month: Numerical
- Preferred payment method: Categorical
- Uses shopping rewards program: Categorical
2
(a) (i) Nominal
Explanation: categories with no natural ordering.
(b) (iii) Discrete
Explanation: a count.
(c) (iv) Continuous
Explanation: a measurement.
(d) (ii) Ordinal
Explanation: ordered categories.
3
(a) Proportion using public transit: 0.303
Brief explanation: proportion = public transit count / total.
(b) Number who bicycle: 46
(c) Percent who drive a car: 44.3%
4
(a) Mean: 68.4
(b) Median: 66.5
(c) Larger: (i) Mean
(d) Shape: (ii) Right-skewed
Explanation: the outlier 95 pulls the mean to the right.
5
(a) Approximate median: 36.9 minutes
(b) Approximate IQR: 12.8 minutes
6
Answer: (D)
Explanation: p-value 0.72 is large → essentially no evidence against (H_0).
7
Answer: (C)
Explanation: Rejecting at () means the data give convincing evidence against (H_0).
8
Answer: (B)
Explanation: Higher confidence → wider interval.
9
Correct choices: (A) and (C)
Explanation: CI is centered at ({x}) so ({x}=50). Proper wording is “we are 95% confident …”.
10
95% bootstrap CI: (0.48, 0.62)
Answer: (D)
Explanation: 0.5 is inside the 95% CI → fail to reject in a two-sided 5% test.
11
(a) (ii) Convenience sampling
(b) (iii) No, the sample may not be representative
12
Correct choices: (B) and (C)
13
Answer: (C)
14
(a) True
(b) False
(c) False
15
(a) (ii)
(b) (ii)
(c) (=) 0.62
(d) p-value () 0.039
(e) (iii)
(f) (i) Reject (H_0)
(g) (i)
16
(a) (iii)
(b) (=) 0.65
(c) (ii)
(d) Lower () 0.55
(e) Upper () 0.75
(f) (iii)
(g) (i)